| <-- eyeonlakeo.com | --------- Click for Other Years --------- | |||||||||
| 2019 | 2018 | 2017 | 2016 | |||||||
| Query Inputs: | ||||||||||
| Start Date | 1/1/2017 | 20170101 | ||||||||
| End Date | 12/31/2017 | 20171231 | ||||||||
| Structure | S-80 at the St. Lucie Canal | <- select structure from drop-down list | ||||||||
| DBKey | DJ238 | |||||||||
| Last Update | 3/31/2019 | 1:37 PM | ||||||||
| Summary of Query Results | ||||||||||
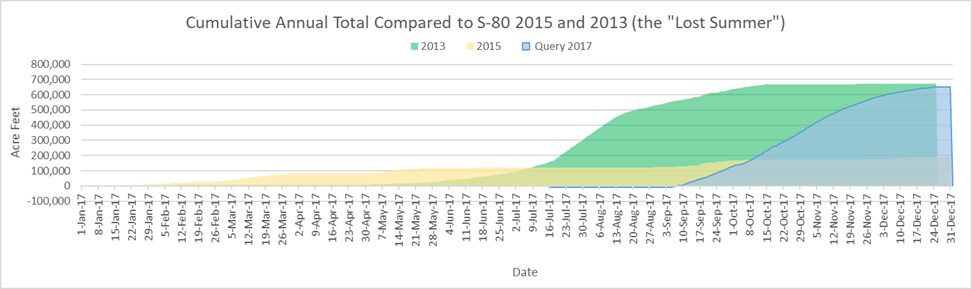
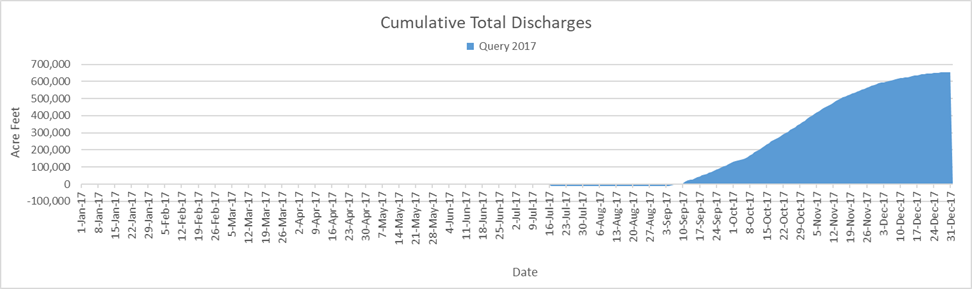
| Between January, 1, 2017 and December, 31, 2017, S-80 at the St. Lucie Canal discharged 212,543,907,041 (212.54 billion) gallons of water at an average of 583,911,833 gallons per day. | ||||||||||
| - This is equal to 652,274 acre feet of water at an average of 1,792 acre feet per day. | ||||||||||
| - That amount would submerge the peninsula of Stuart, Florida north of Monterey Rd. under 273 feet of water. | ||||||||||
| - 273 feet is equal to 2. times the height of the water tower in downtown Stuart. | ||||||||||
| - This is equal to the volume of water that would be required to lower Lake Okeechobee by 16.76 inches (1.4 feet) | ||||||||||
| Query Results Table | (DATA NOT VERIFIED) | |||||||||
| Date | # | cubic feet | gallons | billion gallons | Acre Feet | Stuart Inches | Stuart Feet | Lake Inches | ||
| Start Date of query results | 1/1/2017 | |||||||||
| End Date of query results | 12/31/2017 | |||||||||
| Number of Days | 364 | |||||||||
| Number of Days Missing Data | - | |||||||||
| Last date with numerical data | 12/31/2017 | 0 | ||||||||
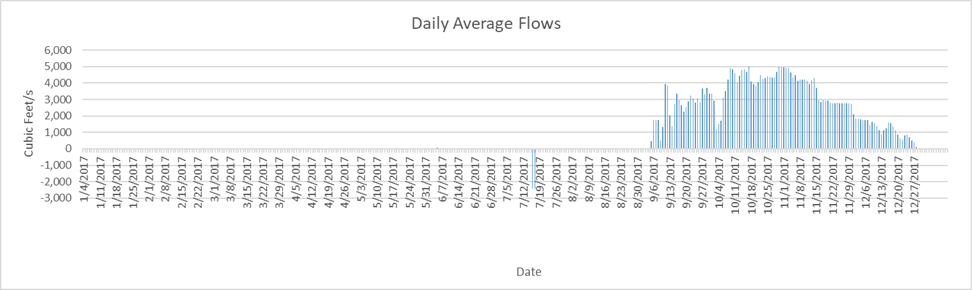
| Highest Flow Rate (per second)* | 10/17/2017 | 5,037 | 37,679 | |||||||
| Highest Flow Rate (per day)* | 10/17/2017 | 435,196,800 | 3,255,498,366 | 3.26 | 9,990.77 | 50.09 | 4.17 | 0.26 | ||
| Days of Highest Flow Rate | 1 | |||||||||
| Lowest Flow Rate (per second)* | 7/16/2017 | (2,429) | (18,170) | <-- erroneous data from ACOE db key DJ238 | ||||||
| Lowest Flow Rate (per day)* | 7/16/2017 | (209,865,600) | (1,569,903,818) | (1.57) | (4,817.86) | (24.15) | (2.01) | |||
| Days of Lowest Flow Rate | 2 | |||||||||
| Average Flow Rate (per second) | 903.45 | 6,758 | ||||||||
| Average Flow Rate (per day) | 78,057,653 | 583,911,833 | 0.58 | 1,791.96 | 8.98 | 0.75 | 0.05 | |||
| Total Flow | 28,412,985,600 | 212,543,907,041 | 212.54 | 652,273.89 | 3,270.09 | 272.51 | 16.76 | |||
| * = If there is more than one date of highest or lowest flow rate then the first date appears in the date column. | ||||||||||
| Stuart peninsula land area north of Monterey Rd = 3.74 sq miles or 2,393.6 acres | [Click for Map] | |||||||||
| Lake Okeechobee Average Surface Area = 467,000 acres (approx 730 sq mi). | [See LORS2008] | |||||||||
| The water tower in downtown Stuart is 134 feet tall | [TC Palm] | |||||||||
|
||||||||||
|
||||||||||
|
||||||||||
![[Click for Map]](http://thurlowpa.com/StuartNorthofMonterey.jpg)