| <-- eyeonlakeo.com | --------- Click for Other Years --------- | ||||||||||||||||
| 2020 | 2019 | 2018 | 2017 | 2016 | |||||||||||||
| Query Inputs: | |||||||||||||||||
| Start Date | 1/1/2018 | 20180101 | |||||||||||||||
| End Date | 12/31/2018 | 20181231 | |||||||||||||||
| Structure | S-308 at Port Mayaca | <- select structure from drop-down list | |||||||||||||||
| DBKey | DJ239 | ||||||||||||||||
| Last Update | 8/29/2020 | 5:33 PM | |||||||||||||||
| Summary of Query Results | |||||||||||||||||
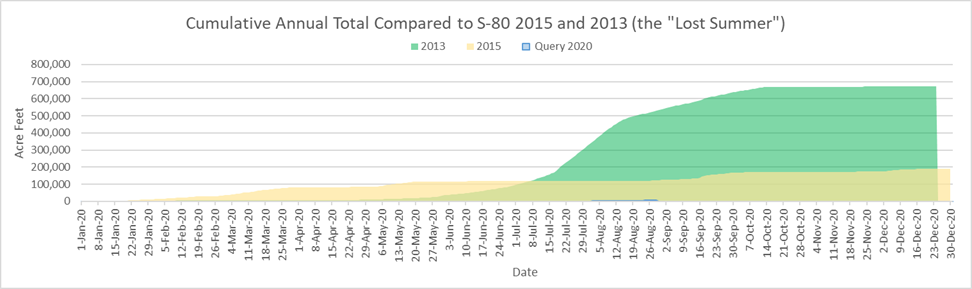
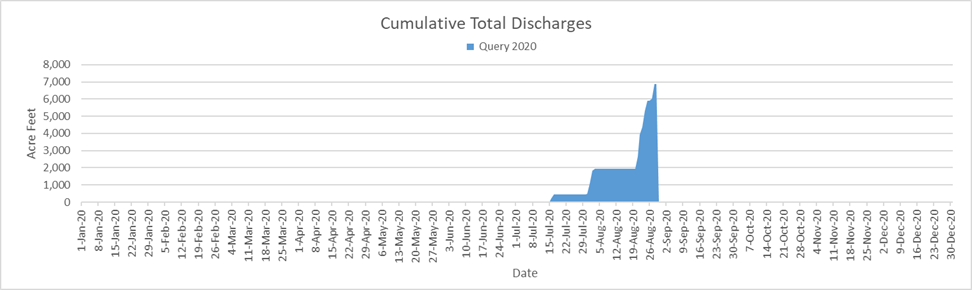
| Between January, 1, 2020 and August, 28, 2020, S-308 at Port Mayaca discharged 2,236,902,888 (2.24 billion) gallons of water at an average of 9,281,755 gallons per day. | |||||||||||||||||
| - This is equal to 6,865 acre feet of water at an average of 28 acre feet per day. | |||||||||||||||||
| - That amount would submerge the peninsula of Stuart, Florida north of Monterey Rd. under 3 feet of water. | |||||||||||||||||
| - 3 feet is equal to 2.1% the height of the water tower in downtown Stuart. | |||||||||||||||||
| - This is equal to the volume of water that would be required to lower Lake Okeechobee by .18 inches (.01 feet) | |||||||||||||||||
| Query Results Table | (DATA NOT VERIFIED) | ||||||||||||||||
| Date | # | cubic feet | gallons | billion gallons | Acre Feet | Stuart Inches | Stuart Feet | Lake Inches | |||||||||
| Start Date of query results | 1/1/2020 | ||||||||||||||||
| End Date of query results | 8/29/2020 | ||||||||||||||||
| Number of Days | 242 | ||||||||||||||||
| Number of Days Missing Data | 1 | ||||||||||||||||
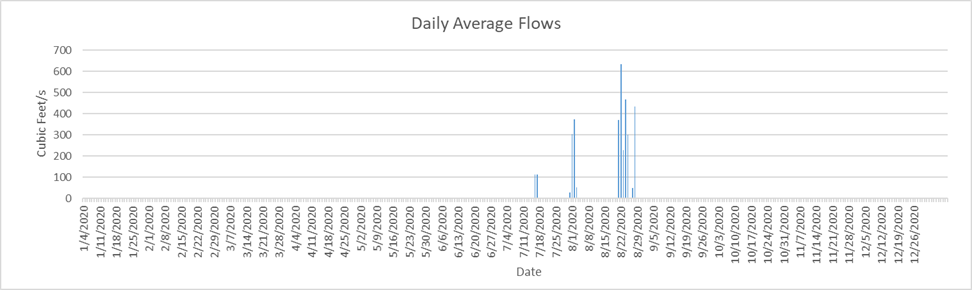
| Last date with numerical data | 8/28/2020 | 435 | |||||||||||||||
| Highest Flow Rate (per second)* | 8/22/2020 | 635 | 4,750 | ||||||||||||||
| Highest Flow Rate (per day)* | 8/22/2020 | 54,864,000 | 410,411,249 | 0.41 | 1,259.51 | 6.31 | 0.53 | 0.03 | |||||||||
| Days of Highest Flow Rate | 1 | ||||||||||||||||
| Lowest Flow Rate (per second)* | 1/1/2020 | - | - | ||||||||||||||
| Lowest Flow Rate (per day)* | 1/1/2020 | - | - | - | - | - | - | ||||||||||
| Days of Lowest Flow Rate | 228 | ||||||||||||||||
| Average Flow Rate (per second) | 14.36 | 107 | |||||||||||||||
| Average Flow Rate (per day) | 1,240,790 | 9,281,755 | 0.01 | 28.48 | 0.14 | 0.01 | 0.00 | ||||||||||
| Last Day with positive flow | 8/28/2020 | 37,584,000 | 281,147,864 | 0.28 | 862.81 | 4.33 | 0.36 | 0.02 | |||||||||
| Last one day total | 8/28/2020 | 1 | 37,584,000 | 281,147,864 | 0.28 | 862.81 | 4.33 | 0.36 | 0.02 | ||||||||
| Last 7 days | 8/21/2020 | 7 | 214,617,600 | 1,605,451,249 | 1.61 | 4,926.95 | 24.70 | 2.06 | 0.13 | ||||||||
| Last 45 days | 7/14/2020 | 45 | 299,030,400 | 2,236,902,888 | 2.24 | 6,864.81 | 34.42 | 2.87 | 0.18 | ||||||||
| Last 90 days | 5/30/2020 | 90 | 299,030,400 | 2,236,902,888 | 2.24 | 6,864.81 | 34.42 | 2.87 | 0.18 | ||||||||
| Total Flow for 242 days | 299,030,400 | 2,236,902,888 | 2.24 | 6,864.81 | 34.42 | 2.87 | 0.18 | ||||||||||
| * = If there is more than one date of highest or lowest flow rate then the first date appears in the date column. | |||||||||||||||||
| Stuart peninsula land area north of Monterey Rd = 3.74 sq miles or 2,393.6 acres | [Click for Map] | ||||||||||||||||
| Lake Okeechobee Average Surface Area = 467,000 acres (approx 730 sq mi). | [See LORS2008] | ||||||||||||||||
| The water tower in downtown Stuart is 134 feet tall | [TC Palm] | ||||||||||||||||
|
|||||||||||||||||
|
|||||||||||||||||
![[Click for Map]](http://thurlowpa.com/StuartNorthofMonterey.jpg)