eyeonlakeo.com
Live and Historical Data
Live data feeds from South Florida Water Management District, Army Corps of Engineers and Florida Dept. of Environmental Protection
Big O Chart
and Number Cruncher
Ecological Envelope vs. Current Lake Stage RECOVER and SFWMD Position Analysis
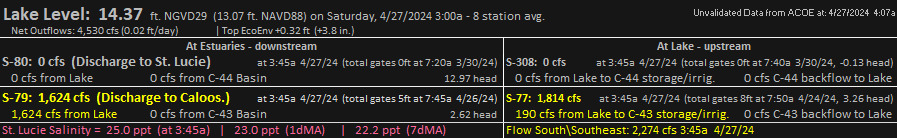
Current
Lake Okeechobee Level, 8 Station Elevations, Wind Speed and Direction
All Active Salinity Stations in DBHydro (Top and Bottom)
Salinity Averages St. Lucie River
Lake and C-44 Basin Discharges 1952-current
C44 Reservoir Inflows STA Outflows and Reservoir Storage
Daily Status Map ACOE
Lake O Daily Outlook Plot
(ACOE)
Roosevelt Bridge Salinity
S-308 Graph (Port Mayaca)
S-80 Graph (Spillway at St. Lucie Locks)
STA Reports SFWMD
SFWMD Live Lake O Inflows and Outflows
SFWMD LIve S-80 Details
Roosevelt Bridge Tide Graph
Historical Flows By Site DBKey
Cumulative Dischrge Totals, S-80, S-308, S-79 and S-77 with conversions
2013 (The "Lost Summer) vs 2023
Lake Level on June 1
vs.
Lake Discharges to Estuaries from June 1 - Dec 31
Next:
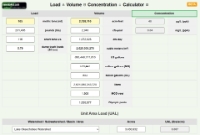
Calculators and Tools