| <-- eyeonlakeo.com | Select Year --> | 2021 | 2020 | 2019 | 2018 | 2017 | ||||
| Select Structure-> | S-80 | S-308 | S-79 | S-77 | ||||||
| Query Inputs: | ||||||||||
| Start Date | 1/1/2021 | 20210101 | ||||||||
| End Date | 12/31/2021 | 20211231 | ||||||||
| Structure | S-80 at the St. Lucie Canal | |||||||||
| DBKey | DJ238 | |||||||||
| Last Update | 12/1/2021 | 12:15 AM | Next Autoupdate: | 12/1/2021 | 4:15 AM | |||||
| Summary of Query Results | ||||||||||
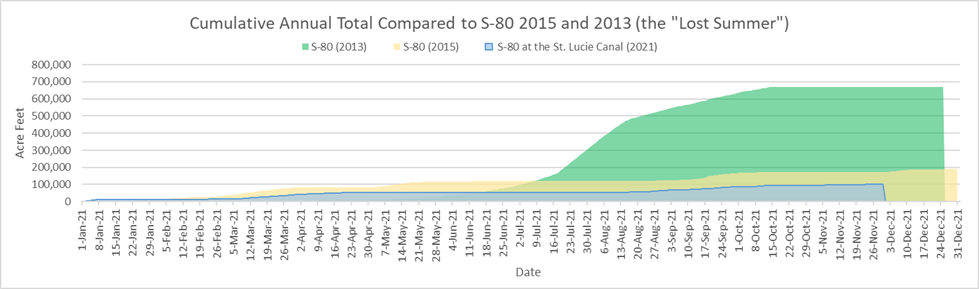
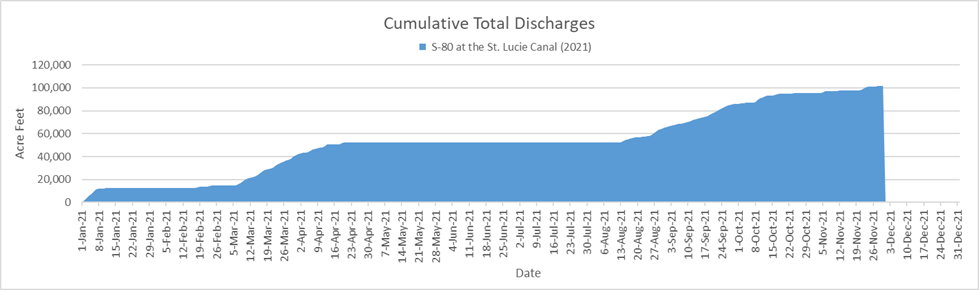
| Between January, 1, 2021 and November, 29, 2021, S-80 at the St. Lucie Canal discharged 33,190,313,204 (33.19 billion) gallons of water at an average of 99,670,610 gallons per day. | ||||||||||
| - This is equal to 101,857 acre feet of water at an average of 306 acre feet per day. | ||||||||||
| - That amount would submerge the peninsula of Stuart, Florida north of Monterey Rd. under 43 feet of water. | ||||||||||
| - 43 feet is equal to 31.8% the height of the water tower in downtown Stuart. | ||||||||||
| - This is equal to the volume of water that would be required to lower Lake Okeechobee by 2.62 inches (.22 feet) | ||||||||||
| Query Results Table | (DATA NOT VERIFIED) | |||||||||
| Date | # | cubic feet | gallons | billion gallons | Acre Feet | Stuart Inches | Stuart Feet | Lake Inches | ||
| Start Date of query results | 1/1/2021 | |||||||||
| End Date of query results | 11/30/2021 | |||||||||
| Number of Days | 334 | |||||||||
| Number of Days Missing Data | 1 | |||||||||
| Last date with numerical data | 11/29/2021 | 132 | ||||||||
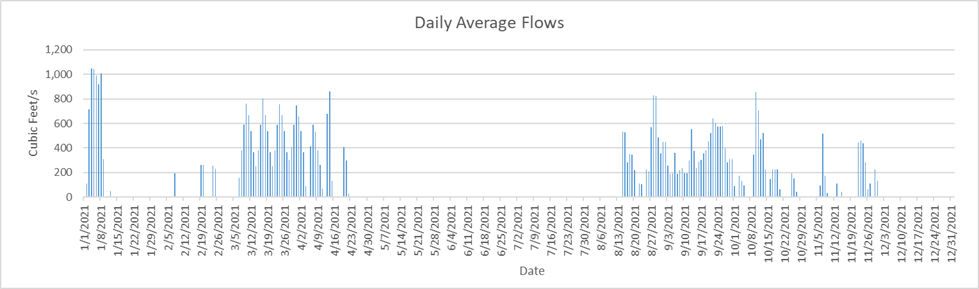
| Highest Flow Rate (per second)* | 1/3/2021 | 1,047 | 7,832 | |||||||
| Highest Flow Rate (per day)* | 1/3/2021 | 90,460,800 | 676,693,824 | 0.68 | 2,076.70 | 10.41 | 0.87 | 0.05 | ||
| Days of Highest Flow Rate | 1 | |||||||||
| Lowest Flow Rate (per second)* | 1/9/2021 | - | - | |||||||
| Lowest Flow Rate (per day)* | 1/9/2021 | - | - | - | - | - | - | |||
| Days of Lowest Flow Rate | 201 | |||||||||
| Average Flow Rate (per second) | 154.21 | 1,154 | ||||||||
| Average Flow Rate (per day) | 13,324,022 | 99,670,610 | 0.10 | 305.88 | 1.53 | 0.13 | 0.01 | |||
| Last Day with positive flow | 11/29/2021 | 11,404,800 | 85,313,834 | 0.09 | 261.82 | 1.31 | 0.11 | 0.01 | ||
| Last one day total | 11/29/2021 | 1 | 11,404,800 | 85,313,834 | 0.09 | 261.82 | 1.31 | 0.11 | 0.01 | |
| Last 7 days | 11/22/2021 | 7 | 148,003,200 | 1,107,140,898 | 1.11 | 3,397.69 | 17.03 | 1.42 | 0.09 | |
| Last 45 days | 10/15/2021 | 45 | 380,592,000 | 2,847,026,068 | 2.85 | 8,737.21 | 43.80 | 3.65 | 0.22 | |
| Last 90 days | 8/31/2021 | 90 | 1,641,772,800 | 12,281,314,266 | 12.28 | 37,690.00 | 188.95 | 15.75 | 0.97 | |
| Total Flow for 334 days | 4,436,899,200 | 33,190,313,204 | 33.19 | 101,857.42 | 510.65 | 42.55 | 2.62 | |||
| * = If there is more than one date of highest or lowest flow rate then the first date appears in the date column. | ||||||||||
| Stuart peninsula land area north of Monterey Rd = 3.74 sq miles or 2,393.6 acres | [Click for Map] | |||||||||
| Lake Okeechobee Average Surface Area = 467,000 acres (approx 730 sq mi). | [See LORS2008] | |||||||||
| The water tower in downtown Stuart is 134 feet tall | [TC Palm] | |||||||||
|
||||||||||
|
||||||||||
|
||||||||||
![[Click for Map]](http://thurlowpa.com/StuartNorthofMonterey.jpg)