| <-- eyeonlakeo.com | Select Year --> | 2021 | 2020 | 2019 | 2018 | 2017 | ||||
| Select Structure-> | S-80 | S-308 | S-79 | S-77 | ||||||
| Query Inputs: | ||||||||||
| Start Date | 1/1/2021 | 20210101 | ||||||||
| End Date | 12/31/2021 | 20211231 | ||||||||
| Structure | S-308 at Port Mayaca | |||||||||
| DBKey | DJ239 | |||||||||
| Last Update | 12/1/2021 | 12:15 AM | Next Autoupdate: | 12/1/2021 | 4:15 AM | |||||
| Summary of Query Results | ||||||||||
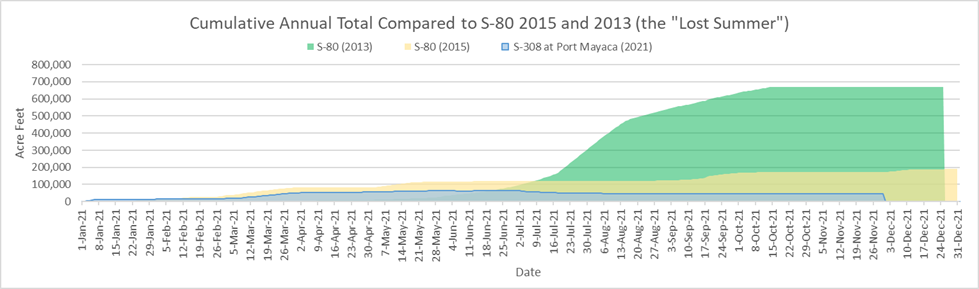
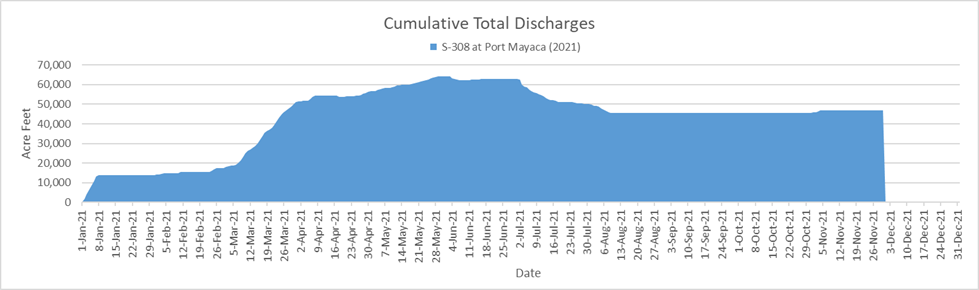
| Between January, 1, 2021 and November, 29, 2021, S-308 at Port Mayaca discharged 15,224,447,661 (15.22 billion) gallons of water at an average of 46,274,917 gallons per day. | ||||||||||
| - This is equal to 46,722 acre feet of water at an average of 142 acre feet per day. | ||||||||||
| - That amount would submerge the peninsula of Stuart, Florida north of Monterey Rd. under 20 feet of water. | ||||||||||
| - 20 feet is equal to 14.6% the height of the water tower in downtown Stuart. | ||||||||||
| - This is equal to the volume of water that would be required to lower Lake Okeechobee by 1.2 inches (.1 feet) | ||||||||||
| Query Results Table | (DATA NOT VERIFIED) | |||||||||
| Date | # | cubic feet | gallons | billion gallons | Acre Feet | Stuart Inches | Stuart Feet | Lake Inches | ||
| Start Date of query results | 1/1/2021 | |||||||||
| End Date of query results | 11/30/2021 | |||||||||
| Number of Days | 334 | |||||||||
| Number of Days Missing Data | 5 | |||||||||
| Last date with numerical data | 11/29/2021 | 0 | ||||||||
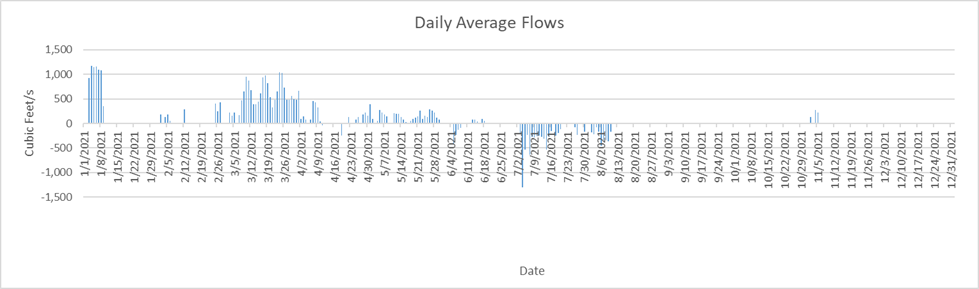
| Highest Flow Rate (per second)* | 1/3/2021 | 1,170 | 8,752 | |||||||
| Highest Flow Rate (per day)* | 1/3/2021 | 101,088,000 | 756,190,806 | 0.76 | 2,320.67 | 11.63 | 0.97 | 0.06 | ||
| Days of Highest Flow Rate | 1 | |||||||||
| Lowest Flow Rate (per second)* | 7/3/2021 | (1,301) | (9,732) | |||||||
| Lowest Flow Rate (per day)* | 7/3/2021 | (112,406,400) | (840,858,323) | (0.84) | (2,580.50) | (12.94) | (1.08) | |||
| Days of Lowest Flow Rate | 1 | |||||||||
| Average Flow Rate (per second) | 71.60 | 536 | ||||||||
| Average Flow Rate (per day) | 6,186,056 | 46,274,917 | 0.05 | 142.01 | 0.71 | 0.06 | 0.00 | |||
| Last Day with positive flow | 11/4/2021 | 19,353,600 | 144,774,992 | 0.14 | 444.30 | 2.23 | 0.19 | 0.01 | ||
| Last one day total | 11/29/2021 | 1 | - | - | - | - | - | - | - | |
| Last 7 days | 11/22/2021 | 7 | - | - | - | - | - | - | - | |
| Last 45 days | 10/15/2021 | 45 | 54,777,600 | 409,764,932 | 0.41 | 1,257.52 | 6.30 | 0.53 | 0.03 | |
| Last 90 days | 8/31/2021 | 90 | 54,777,600 | 409,764,932 | 0.41 | 1,257.52 | 6.30 | 0.53 | 0.03 | |
| Total Flow for 334 days | 2,035,212,480 | 15,224,447,661 | 15.22 | 46,722.16 | 234.24 | 19.52 | 1.20 | |||
| * = If there is more than one date of highest or lowest flow rate then the first date appears in the date column. | ||||||||||
| Stuart peninsula land area north of Monterey Rd = 3.74 sq miles or 2,393.6 acres | [Click for Map] | |||||||||
| Lake Okeechobee Average Surface Area = 467,000 acres (approx 730 sq mi). | [See LORS2008] | |||||||||
| The water tower in downtown Stuart is 134 feet tall | [TC Palm] | |||||||||
|
||||||||||
|
||||||||||
|
||||||||||
![[Click for Map]](http://thurlowpa.com/StuartNorthofMonterey.jpg)