| <-- eyeonlakeo.com | Select Year --> | 2021 | 2020 | 2019 | 2018 | 2017 | ||||
| Select Structure-> | S-80 | S-308 | S-79 | S-77 | ||||||
| Query Inputs: | ||||||||||
| Start Date | 1/1/2021 | 20210101 | ||||||||
| End Date | 12/31/2021 | 20211231 | ||||||||
| Structure | S-77 at Moore Haven - Caloosahatchee | |||||||||
| DBKey | DJ235 | |||||||||
| Last Update | 12/1/2021 | 12:15 AM | Next Autoupdate: | 12/1/2021 | 4:15 AM | |||||
| Summary of Query Results | ||||||||||
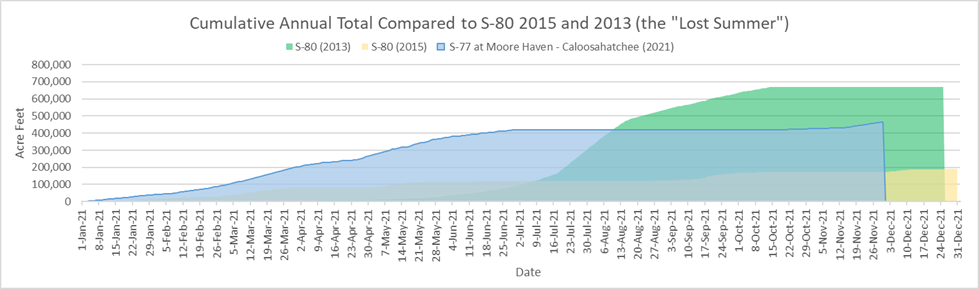
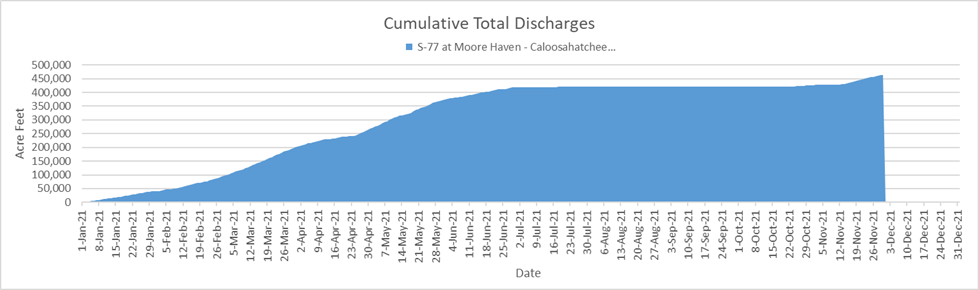
| Between January, 1, 2021 and November, 29, 2021, S-77 at Moore Haven - Caloosahatchee discharged 151,105,019,865 (151.11 billion) gallons of water at an average of 453,768,828 gallons per day. | ||||||||||
| - This is equal to 463,725 acre feet of water at an average of 1,393 acre feet per day. | ||||||||||
| - That amount would submerge the peninsula of Stuart, Florida north of Monterey Rd. under 194 feet of water. | ||||||||||
| - 194 feet is equal to 1.4 times the height of the water tower in downtown Stuart. | ||||||||||
| - This is equal to the volume of water that would be required to lower Lake Okeechobee by 11.92 inches (.99 feet) | ||||||||||
| Query Results Table | (DATA NOT VERIFIED) | |||||||||
| Date | # | cubic feet | gallons | billion gallons | Acre Feet | Stuart Inches | Stuart Feet | Lake Inches | ||
| Start Date of query results | 1/1/2021 | |||||||||
| End Date of query results | 11/30/2021 | |||||||||
| Number of Days | 334 | |||||||||
| Number of Days Missing Data | 1 | |||||||||
| Last date with numerical data | 11/29/2021 | 1243 | ||||||||
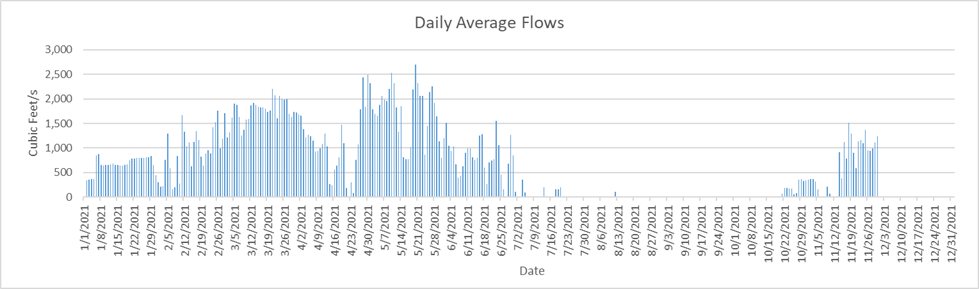
| Highest Flow Rate (per second)* | 5/19/2021 | 2,692 | 20,138 | |||||||
| Highest Flow Rate (per day)* | 5/19/2021 | 232,588,800 | 1,739,885,170 | 1.74 | 5,339.52 | 26.77 | 2.23 | 0.14 | ||
| Days of Highest Flow Rate | 1 | |||||||||
| Lowest Flow Rate (per second)* | 4/21/2021 | - | - | |||||||
| Lowest Flow Rate (per day)* | 4/21/2021 | - | - | - | - | - | - | |||
| Days of Lowest Flow Rate | 112 | |||||||||
| Average Flow Rate (per second) | 702.08 | 5,252 | ||||||||
| Average Flow Rate (per day) | 60,660,065 | 453,768,828 | 0.45 | 1,392.57 | 6.98 | 0.58 | 0.04 | |||
| Last Day with positive flow | 11/29/2021 | 107,395,200 | 803,371,942 | 0.80 | 2,465.46 | 12.36 | 1.03 | 0.06 | ||
| Last one day total | 11/29/2021 | 1 | 107,395,200 | 803,371,942 | 0.80 | 2,465.46 | 12.36 | 1.03 | 0.06 | |
| Last 7 days | 11/22/2021 | 7 | 766,886,400 | 5,736,709,053 | 5.74 | 17,605.33 | 88.26 | 7.36 | 0.45 | |
| Last 45 days | 10/15/2021 | 45 | 1,873,843,200 | 14,017,321,534 | 14.02 | 43,017.62 | 215.66 | 17.97 | 1.11 | |
| Last 90 days | 8/31/2021 | 90 | 1,873,843,200 | 14,017,321,534 | 14.02 | 43,017.62 | 215.66 | 17.97 | 1.11 | |
| Total Flow for 334 days | 20,199,801,600 | 151,105,019,865 | 151.11 | 463,724.70 | 2,324.82 | 193.74 | 11.92 | |||
| * = If there is more than one date of highest or lowest flow rate then the first date appears in the date column. | ||||||||||
| Stuart peninsula land area north of Monterey Rd = 3.74 sq miles or 2,393.6 acres | [Click for Map] | |||||||||
| Lake Okeechobee Average Surface Area = 467,000 acres (approx 730 sq mi). | [See LORS2008] | |||||||||
| The water tower in downtown Stuart is 134 feet tall | [TC Palm] | |||||||||
|
||||||||||
|
||||||||||
|
||||||||||
![[Click for Map]](http://thurlowpa.com/StuartNorthofMonterey.jpg)