| <-- eyeonlakeo.com | Select Year --> | 2021 | 2020 | 2019 | 2018 | 2017 | ||||
| Select Structure-> | S-80 | S-308 | S-79 | S-77 | ||||||
| Query Inputs: | ||||||||||
| Start Date | 1/1/2017 | 20170101 | ||||||||
| End Date | 12/31/2017 | 20171231 | ||||||||
| Structure | S-79 at Franklin Lock - Caloosahatchee | |||||||||
| DBKey | DJ237 | |||||||||
| Last Update | 11/1/2021 | 7:23 AM | ||||||||
| Summary of Query Results | ||||||||||
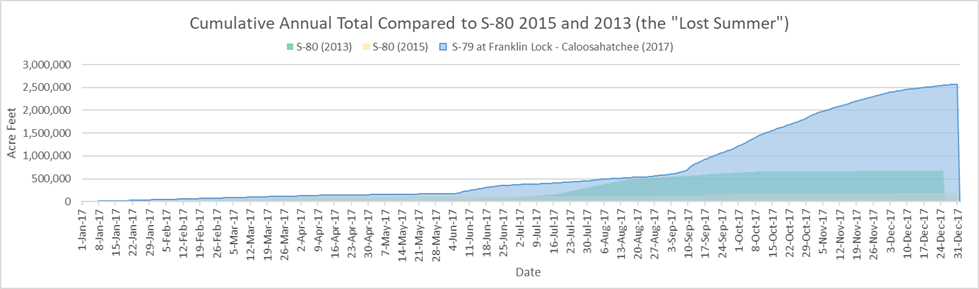
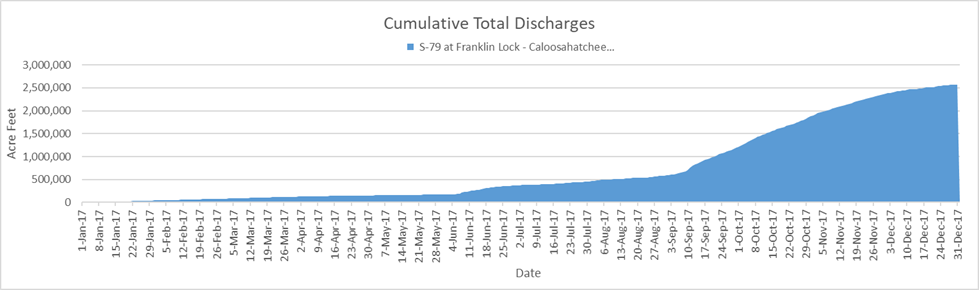
| Between January, 1, 2017 and December, 31, 2017, S-79 at Franklin Lock - Caloosahatchee discharged 838,825,074,904 (838.83 billion) gallons of water at an average of 2,298,150,890 gallons per day. | ||||||||||
| - This is equal to 2,574,262 acre feet of water at an average of 7,053 acre feet per day. | ||||||||||
| - That amount would submerge the peninsula of Stuart, Florida north of Monterey Rd. under 1,075 feet of water. | ||||||||||
| - 1,075 feet is equal to 8. times the height of the water tower in downtown Stuart. | ||||||||||
| - This is equal to the volume of water that would be required to lower Lake Okeechobee by 66.15 inches (5.51 feet) | ||||||||||
| Query Results Table | (DATA NOT VERIFIED) | |||||||||
| Date | # | cubic feet | gallons | billion gallons | Acre Feet | Stuart Inches | Stuart Feet | Lake Inches | ||
| Start Date of query results | 1/1/2017 | |||||||||
| End Date of query results | 12/31/2017 | |||||||||
| Number of Days | 365 | |||||||||
| Number of Days Missing Data | - | |||||||||
| Last date with numerical data | 12/31/2017 | 1880 | ||||||||
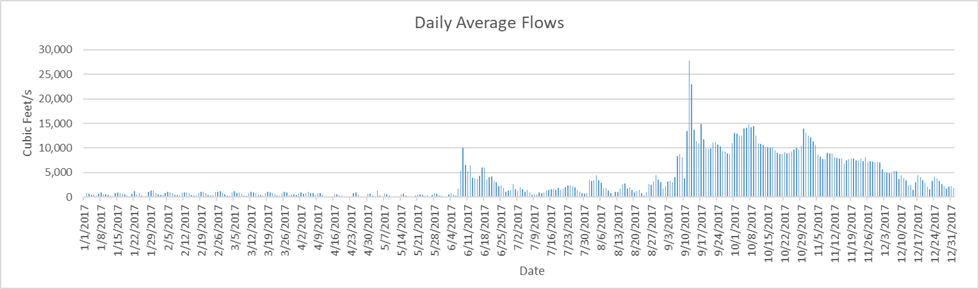
| Highest Flow Rate (per second)* | 9/11/2017 | 27,783 | 207,831 | |||||||
| Highest Flow Rate (per day)* | 9/11/2017 | 2,400,451,200 | 17,956,623,211 | 17.96 | 55,106.90 | 276.27 | 23.02 | 1.42 | ||
| Days of Highest Flow Rate | 1 | |||||||||
| Lowest Flow Rate (per second)* | 4/20/2017 | - | - | |||||||
| Lowest Flow Rate (per day)* | 4/20/2017 | - | - | - | - | - | - | |||
| Days of Lowest Flow Rate | 6 | |||||||||
| Average Flow Rate (per second) | 3,555.76 | 26,599 | ||||||||
| Average Flow Rate (per day) | 307,218,066 | 2,298,150,890 | 2.30 | 7,052.77 | 35.36 | 2.95 | 0.18 | |||
| Last Day with positive flow | 12/31/2017 | 162,432,000 | 1,215,075,825 | 1.22 | 3,728.93 | 18.69 | 1.56 | 0.10 | ||
| Last one day total | 12/31/2017 | 1 | 162,432,000 | 1,215,075,825 | 1.22 | 3,728.93 | 18.69 | 1.56 | 0.10 | |
| Last 7 days | 12/24/2017 | 7 | 1,742,342,400 | 13,033,627,170 | 13.03 | 39,998.77 | 200.53 | 16.71 | 1.03 | |
| Last 45 days | 11/16/2017 | 45 | 18,962,208,000 | 141,847,176,188 | 141.85 | 435,313.40 | 2,182.39 | 181.87 | 11.19 | |
| Last 90 days | 10/2/2017 | 90 | 59,167,238,400 | 442,601,710,196 | 442.60 | 1,358,296.01 | 6,809.64 | 567.47 | 34.90 | |
| Total Flow for 365 days | 112,134,594,240 | 838,825,074,904 | 838.83 | 2,574,261.98 | 12,905.73 | 1,075.48 | 66.15 | |||
| * = If there is more than one date of highest or lowest flow rate then the first date appears in the date column. | ||||||||||
| Stuart peninsula land area north of Monterey Rd = 3.74 sq miles or 2,393.6 acres | [Click for Map] | |||||||||
| Lake Okeechobee Average Surface Area = 467,000 acres (approx 730 sq mi). | [See LORS2008] | |||||||||
| The water tower in downtown Stuart is 134 feet tall | [TC Palm] | |||||||||
|
||||||||||
|
||||||||||
|
||||||||||
![[Click for Map]](http://thurlowpa.com/StuartNorthofMonterey.jpg)