| <-- eyeonlakeo.com | Select Year --> | 2021 | 2020 | 2019 | 2018 | 2017 | ||||
| Select Structure-> | S-80 | S-308 | S-79 | S-77 | ||||||
| Query Inputs: | ||||||||||
| Start Date | 1/1/2017 | 20170101 | ||||||||
| End Date | 12/31/2017 | 20171231 | ||||||||
| Structure | S-77 at Moore Haven - Caloosahatchee | |||||||||
| DBKey | DJ235 | |||||||||
| Last Update | 11/1/2021 | 7:24 AM | ||||||||
| Summary of Query Results | ||||||||||
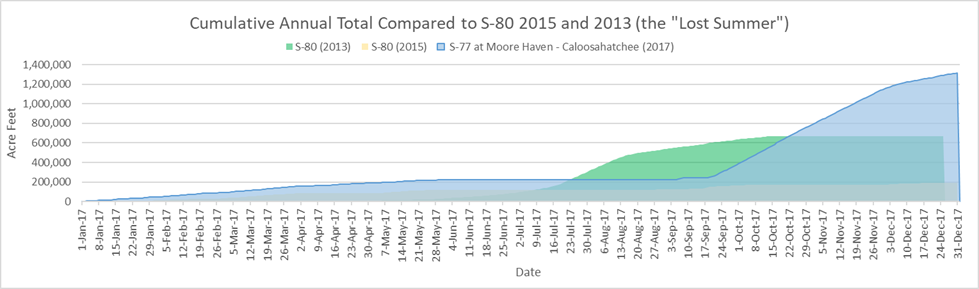
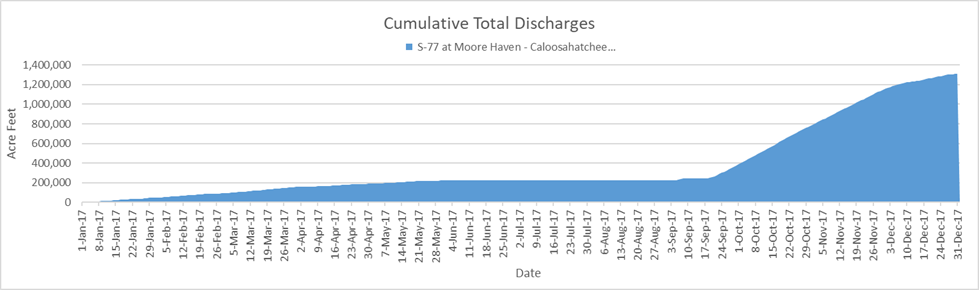
| Between January, 1, 2017 and December, 31, 2017, S-77 at Moore Haven - Caloosahatchee discharged 427,827,034,485 (427.83 billion) gallons of water at an average of 1,188,408,429 gallons per day. | ||||||||||
| - This is equal to 1,312,954 acre feet of water at an average of 3,647 acre feet per day. | ||||||||||
| - That amount would submerge the peninsula of Stuart, Florida north of Monterey Rd. under 549 feet of water. | ||||||||||
| - 549 feet is equal to 4.1 times the height of the water tower in downtown Stuart. | ||||||||||
| - This is equal to the volume of water that would be required to lower Lake Okeechobee by 33.74 inches (2.81 feet) | ||||||||||
| Query Results Table | (DATA NOT VERIFIED) | |||||||||
| Date | # | cubic feet | gallons | billion gallons | Acre Feet | Stuart Inches | Stuart Feet | Lake Inches | ||
| Start Date of query results | 1/1/2017 | |||||||||
| End Date of query results | 12/31/2017 | |||||||||
| Number of Days | 365 | |||||||||
| Number of Days Missing Data | 5 | |||||||||
| Last date with numerical data | 12/31/2017 | 1564 | ||||||||
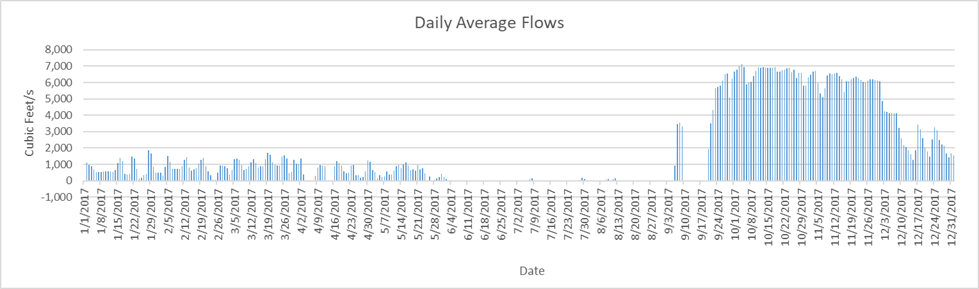
| Highest Flow Rate (per second)* | 10/3/2017 | 7,136 | 53,381 | |||||||
| Highest Flow Rate (per day)* | 10/3/2017 | 616,550,400 | 4,612,117,598 | 4.61 | 14,154.08 | 70.96 | 5.91 | 0.36 | ||
| Days of Highest Flow Rate | 1 | |||||||||
| Lowest Flow Rate (per second)* | 6/2/2017 | (35) | (262) | |||||||
| Lowest Flow Rate (per day)* | 6/2/2017 | (3,024,000) | (22,621,092) | (0.02) | (69.42) | (0.35) | (0.03) | |||
| Days of Lowest Flow Rate | 1 | |||||||||
| Average Flow Rate (per second) | 1,838.74 | 13,755 | ||||||||
| Average Flow Rate (per day) | 158,867,088 | 1,188,408,429 | 1.19 | 3,647.09 | 18.28 | 1.52 | 0.09 | |||
| Last Day with positive flow | 12/31/2017 | 135,129,600 | 1,010,839,675 | 1.01 | 3,102.16 | 15.55 | 1.30 | 0.08 | ||
| Last one day total | 12/31/2017 | 1 | 135,129,600 | 1,010,839,675 | 1.01 | 3,102.16 | 15.55 | 1.30 | 0.08 | |
| Last 7 days | 12/24/2017 | 7 | 1,403,568,000 | 10,499,418,495 | 10.50 | 32,221.56 | 161.54 | 13.46 | 0.83 | |
| Last 45 days | 11/16/2017 | 45 | 15,151,622,400 | 113,342,014,396 | 113.34 | 347,834.19 | 1,743.82 | 145.32 | 8.94 | |
| Last 90 days | 10/2/2017 | 90 | 40,317,955,200 | 301,599,270,233 | 301.60 | 925,575.02 | 4,640.25 | 386.69 | 23.78 | |
| Total Flow for 365 days | 57,192,151,680 | 427,827,034,485 | 427.83 | 1,312,954.15 | 6,582.32 | 548.53 | 33.74 | |||
| * = If there is more than one date of highest or lowest flow rate then the first date appears in the date column. | ||||||||||
| Stuart peninsula land area north of Monterey Rd = 3.74 sq miles or 2,393.6 acres | [Click for Map] | |||||||||
| Lake Okeechobee Average Surface Area = 467,000 acres (approx 730 sq mi). | [See LORS2008] | |||||||||
| The water tower in downtown Stuart is 134 feet tall | [TC Palm] | |||||||||
|
||||||||||
|
||||||||||
|
||||||||||
![[Click for Map]](http://thurlowpa.com/StuartNorthofMonterey.jpg)