| <-- eyeonlakeo.com | Select Year --> | 2021 | 2020 | 2019 | 2018 | 2017 | ||||
| Select Structure-> | S-80 | S-308 | S-79 | S-77 | ||||||
| Query Inputs: | ||||||||||
| Start Date | 1/1/2019 | 20190101 | ||||||||
| End Date | 12/31/2019 | 20191231 | ||||||||
| Structure | S-79 at Franklin Lock - Caloosahatchee | |||||||||
| DBKey | DJ237 | |||||||||
| Last Update | 11/1/2021 | 7:22 AM | ||||||||
| Summary of Query Results | ||||||||||
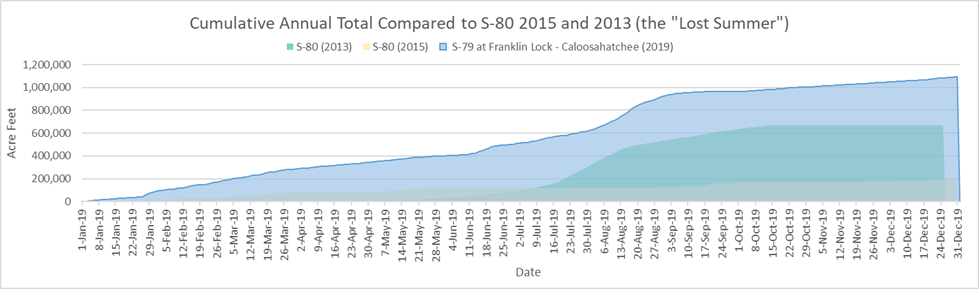
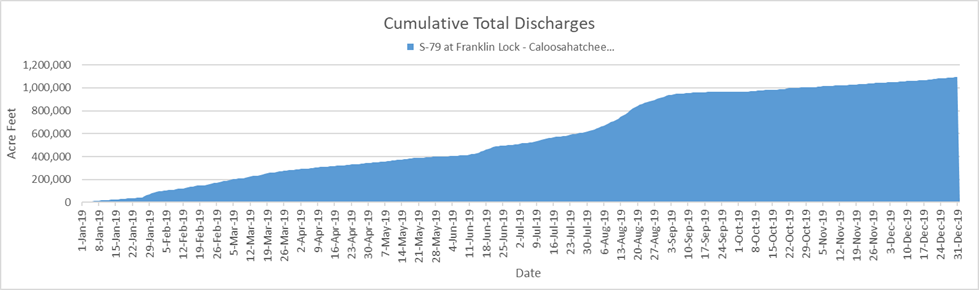
| Between January, 1, 2019 and December, 31, 2019, S-79 at Franklin Lock - Caloosahatchee discharged 356,588,560,784 (356.59 billion) gallons of water at an average of 976,954,961 gallons per day. | ||||||||||
| - This is equal to 1,094,331 acre feet of water at an average of 2,998 acre feet per day. | ||||||||||
| - That amount would submerge the peninsula of Stuart, Florida north of Monterey Rd. under 457 feet of water. | ||||||||||
| - 457 feet is equal to 3.4 times the height of the water tower in downtown Stuart. | ||||||||||
| - This is equal to the volume of water that would be required to lower Lake Okeechobee by 28.12 inches (2.34 feet) | ||||||||||
| Query Results Table | (DATA NOT VERIFIED) | |||||||||
| Date | # | cubic feet | gallons | billion gallons | Acre Feet | Stuart Inches | Stuart Feet | Lake Inches | ||
| Start Date of query results | 1/1/2019 | |||||||||
| End Date of query results | 12/31/2019 | |||||||||
| Number of Days | 365 | |||||||||
| Number of Days Missing Data | - | |||||||||
| Last date with numerical data | 12/31/2019 | 723 | ||||||||
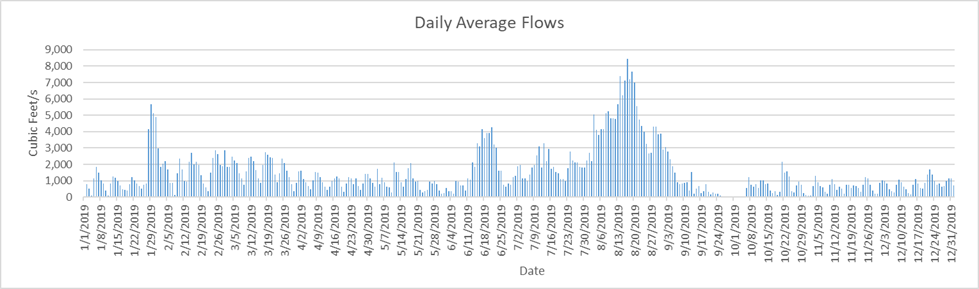
| Highest Flow Rate (per second)* | 8/16/2019 | 8,438 | 63,121 | |||||||
| Highest Flow Rate (per day)* | 8/16/2019 | 729,043,200 | 5,453,622,238 | 5.45 | 16,736.57 | 83.91 | 6.99 | 0.43 | ||
| Days of Highest Flow Rate | 1 | |||||||||
| Lowest Flow Rate (per second)* | 9/26/2019 | - | - | |||||||
| Lowest Flow Rate (per day)* | 9/26/2019 | - | - | - | - | - | - | |||
| Days of Lowest Flow Rate | 9 | |||||||||
| Average Flow Rate (per second) | 1,511.57 | 11,307 | ||||||||
| Average Flow Rate (per day) | 130,599,873 | 976,954,961 | 0.98 | 2,998.17 | 15.03 | 1.25 | 0.08 | |||
| Last Day with positive flow | 12/31/2019 | 62,467,200 | 467,287,139 | 0.47 | 1,434.05 | 7.19 | 0.60 | 0.04 | ||
| Last one day total | 12/31/2019 | 1 | 62,467,200 | 467,287,139 | 0.47 | 1,434.05 | 7.19 | 0.60 | 0.04 | |
| Last 7 days | 12/24/2019 | 7 | 590,716,800 | 4,418,868,837 | 4.42 | 13,561.02 | 67.99 | 5.67 | 0.35 | |
| Last 45 days | 11/16/2019 | 45 | 3,037,132,800 | 22,719,332,653 | 22.72 | 69,723.14 | 349.55 | 29.13 | 1.79 | |
| Last 90 days | 10/2/2019 | 90 | 5,546,620,800 | 41,491,607,827 | 41.49 | 127,333.18 | 638.37 | 53.20 | 3.27 | |
| Total Flow for 365 days | 47,668,953,600 | 356,588,560,784 | 356.59 | 1,094,331.11 | 5,486.29 | 457.19 | 28.12 | |||
| * = If there is more than one date of highest or lowest flow rate then the first date appears in the date column. | ||||||||||
| Stuart peninsula land area north of Monterey Rd = 3.74 sq miles or 2,393.6 acres | [Click for Map] | |||||||||
| Lake Okeechobee Average Surface Area = 467,000 acres (approx 730 sq mi). | [See LORS2008] | |||||||||
| The water tower in downtown Stuart is 134 feet tall | [TC Palm] | |||||||||
|
||||||||||
|
||||||||||
|
||||||||||
![[Click for Map]](http://thurlowpa.com/StuartNorthofMonterey.jpg)