| <-- eyeonlakeo.com | Select Year --> | 2021 | 2020 | 2019 | 2018 | 2017 | ||||
| Select Structure-> | S-80 | S-308 | S-79 | S-77 | ||||||
| Query Inputs: | ||||||||||
| Start Date | 1/1/2020 | 20200101 | ||||||||
| End Date | 12/31/2020 | 20201231 | ||||||||
| Structure | S-79 at Franklin Lock - Caloosahatchee | |||||||||
| DBKey | DJ237 | |||||||||
| Last Update | 11/1/2021 | 7:22 AM | ||||||||
| Summary of Query Results | ||||||||||
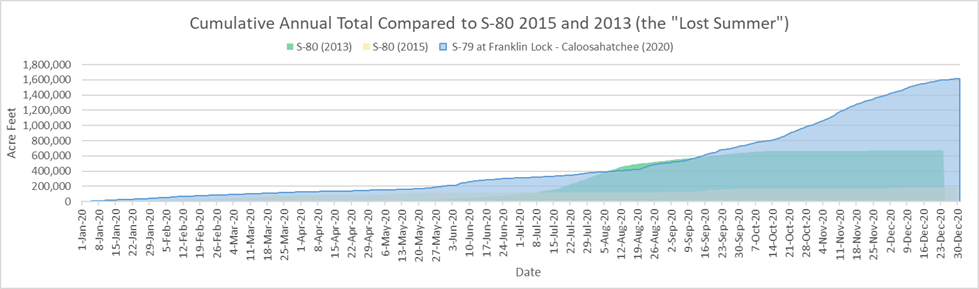
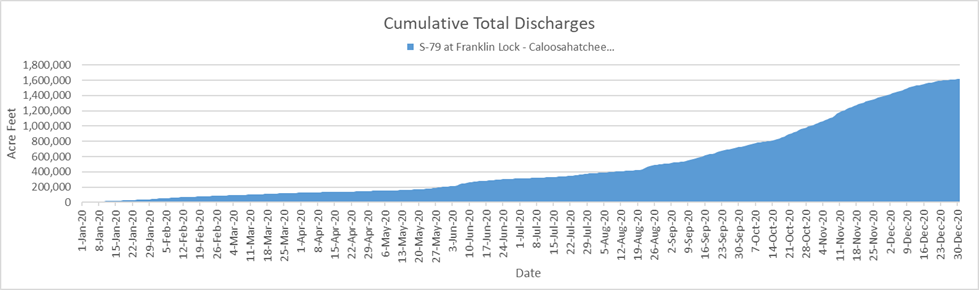
| Between January, 1, 2020 and December, 31, 2020, S-79 at Franklin Lock - Caloosahatchee discharged 527,156,122,302 (527.16 billion) gallons of water at an average of 1,440,317,274 gallons per day. | ||||||||||
| - This is equal to 1,617,784 acre feet of water at an average of 4,420 acre feet per day. | ||||||||||
| - That amount would submerge the peninsula of Stuart, Florida north of Monterey Rd. under 676 feet of water. | ||||||||||
| - 676 feet is equal to 5. times the height of the water tower in downtown Stuart. | ||||||||||
| - This is equal to the volume of water that would be required to lower Lake Okeechobee by 41.57 inches (3.46 feet) | ||||||||||
| Query Results Table | (DATA NOT VERIFIED) | |||||||||
| Date | # | cubic feet | gallons | billion gallons | Acre Feet | Stuart Inches | Stuart Feet | Lake Inches | ||
| Start Date of query results | 1/1/2020 | |||||||||
| End Date of query results | 12/31/2020 | |||||||||
| Number of Days | 366 | |||||||||
| Number of Days Missing Data | - | |||||||||
| Last date with numerical data | 12/31/2020 | 1263 | ||||||||
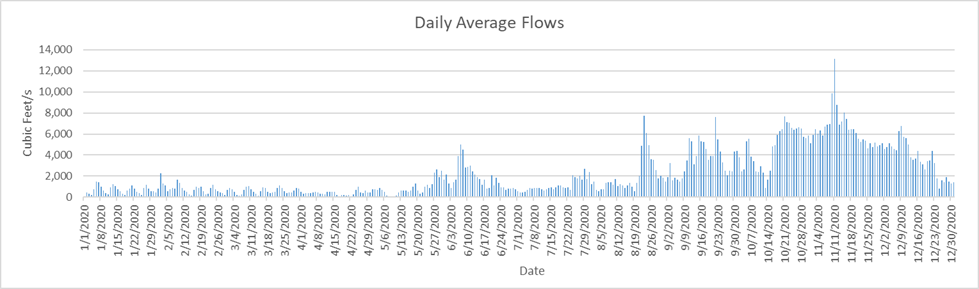
| Highest Flow Rate (per second)* | 11/10/2020 | 13,136 | 98,264 | |||||||
| Highest Flow Rate (per day)* | 11/10/2020 | 1,134,950,400 | 8,490,019,166 | 8.49 | 26,054.94 | 130.62 | 10.89 | 0.67 | ||
| Days of Highest Flow Rate | 1 | |||||||||
| Lowest Flow Rate (per second)* | 4/21/2020 | - | - | |||||||
| Lowest Flow Rate (per day)* | 4/21/2020 | - | - | - | - | - | - | |||
| Days of Lowest Flow Rate | 3 | |||||||||
| Average Flow Rate (per second) | 2,228.50 | 16,670 | ||||||||
| Average Flow Rate (per day) | 192,542,400 | 1,440,317,274 | 1.44 | 4,420.18 | 22.16 | 1.85 | 0.11 | |||
| Last Day with positive flow | 12/31/2020 | 109,123,200 | 816,298,280 | 0.82 | 2,505.13 | 12.56 | 1.05 | 0.06 | ||
| Last one day total | 12/31/2020 | 1 | 109,123,200 | 816,298,280 | 0.82 | 2,505.13 | 12.56 | 1.05 | 0.06 | |
| Last 7 days | 12/24/2020 | 7 | 968,544,000 | 7,245,212,763 | 7.25 | 22,234.76 | 111.47 | 9.29 | 0.57 | |
| Last 45 days | 11/16/2020 | 45 | 16,542,230,400 | 123,744,485,352 | 123.74 | 379,758.23 | 1,903.87 | 158.66 | 9.76 | |
| Last 90 days | 10/2/2020 | 90 | 38,674,627,200 | 289,306,322,262 | 289.31 | 887,849.31 | 4,451.12 | 370.93 | 22.81 | |
| Total Flow for 366 days | 70,470,518,400 | 527,156,122,302 | 527.16 | 1,617,784.21 | 8,110.55 | 675.88 | 41.57 | |||
| * = If there is more than one date of highest or lowest flow rate then the first date appears in the date column. | ||||||||||
| Stuart peninsula land area north of Monterey Rd = 3.74 sq miles or 2,393.6 acres | [Click for Map] | |||||||||
| Lake Okeechobee Average Surface Area = 467,000 acres (approx 730 sq mi). | [See LORS2008] | |||||||||
| The water tower in downtown Stuart is 134 feet tall | [TC Palm] | |||||||||
|
||||||||||
|
||||||||||
|
||||||||||
![[Click for Map]](http://thurlowpa.com/StuartNorthofMonterey.jpg)