| <-- eyeonlakeo.com | Select Year --> | 2021 | 2020 | 2019 | 2018 | 2017 | ||||
| Select Structure-> | S-80 | S-308 | S-79 | S-77 | ||||||
| Query Inputs: | ||||||||||
| Start Date | 1/1/2018 | 20180101 | ||||||||
| End Date | 12/31/2018 | 20181231 | ||||||||
| Structure | S-79 at Franklin Lock - Caloosahatchee | |||||||||
| DBKey | DJ237 | |||||||||
| Last Update | 11/1/2021 | 7:22 AM | ||||||||
| Summary of Query Results | ||||||||||
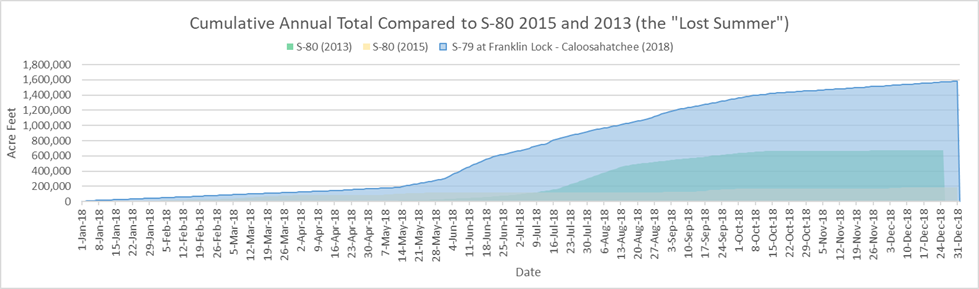
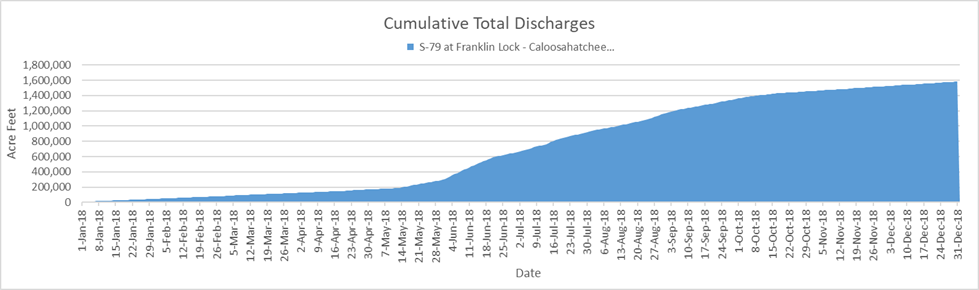
| Between January, 1, 2018 and December, 31, 2018, S-79 at Franklin Lock - Caloosahatchee discharged 515,978,071,032 (515.98 billion) gallons of water at an average of 1,413,638,551 gallons per day. | ||||||||||
| - This is equal to 1,583,480 acre feet of water at an average of 4,338 acre feet per day. | ||||||||||
| - That amount would submerge the peninsula of Stuart, Florida north of Monterey Rd. under 662 feet of water. | ||||||||||
| - 662 feet is equal to 4.9 times the height of the water tower in downtown Stuart. | ||||||||||
| - This is equal to the volume of water that would be required to lower Lake Okeechobee by 40.69 inches (3.39 feet) | ||||||||||
| Query Results Table | (DATA NOT VERIFIED) | |||||||||
| Date | # | cubic feet | gallons | billion gallons | Acre Feet | Stuart Inches | Stuart Feet | Lake Inches | ||
| Start Date of query results | 1/1/2018 | |||||||||
| End Date of query results | 12/31/2018 | |||||||||
| Number of Days | 365 | |||||||||
| Number of Days Missing Data | - | |||||||||
| Last date with numerical data | 12/31/2018 | 946 | ||||||||
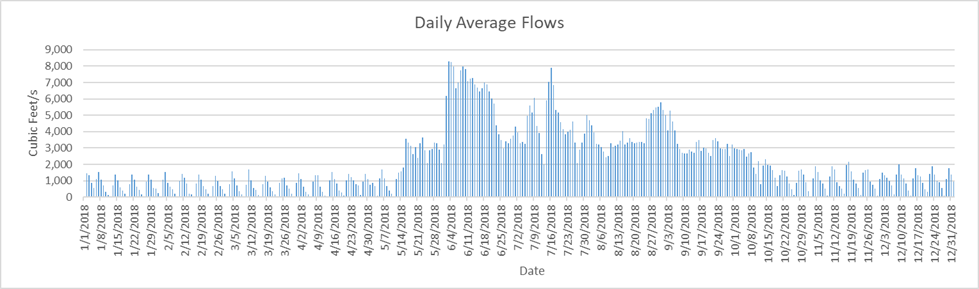
| Highest Flow Rate (per second)* | 6/2/2018 | 8,284 | 61,969 | |||||||
| Highest Flow Rate (per day)* | 6/2/2018 | 715,737,600 | 5,354,089,432 | 5.35 | 16,431.11 | 82.38 | 6.86 | 0.42 | ||
| Days of Highest Flow Rate | 1 | |||||||||
| Lowest Flow Rate (per second)* | 4/12/2018 | - | - | |||||||
| Lowest Flow Rate (per day)* | 4/12/2018 | - | - | - | - | - | - | |||
| Days of Lowest Flow Rate | 1 | |||||||||
| Average Flow Rate (per second) | 2,187.22 | 16,362 | ||||||||
| Average Flow Rate (per day) | 188,975,974 | 1,413,638,551 | 1.41 | 4,338.30 | 21.75 | 1.81 | 0.11 | |||
| Last Day with positive flow | 12/31/2018 | 81,734,400 | 611,415,814 | 0.61 | 1,876.37 | 9.41 | 0.78 | 0.05 | ||
| Last one day total | 12/31/2018 | 1 | 81,734,400 | 611,415,814 | 0.61 | 1,876.37 | 9.41 | 0.78 | 0.05 | |
| Last 7 days | 12/24/2018 | 7 | 670,204,800 | 5,013,480,410 | 5.01 | 15,385.82 | 77.13 | 6.43 | 0.40 | |
| Last 45 days | 11/16/2018 | 45 | 4,257,100,800 | 31,845,327,676 | 31.85 | 97,729.81 | 489.96 | 40.83 | 2.51 | |
| Last 90 days | 10/2/2018 | 90 | 9,690,278,400 | 72,488,321,377 | 72.49 | 222,458.69 | 1,115.27 | 92.94 | 5.72 | |
| Total Flow for 365 days | 68,976,230,400 | 515,978,071,032 | 515.98 | 1,583,480.00 | 7,938.57 | 661.55 | 40.69 | |||
| * = If there is more than one date of highest or lowest flow rate then the first date appears in the date column. | ||||||||||
| Stuart peninsula land area north of Monterey Rd = 3.74 sq miles or 2,393.6 acres | [Click for Map] | |||||||||
| Lake Okeechobee Average Surface Area = 467,000 acres (approx 730 sq mi). | [See LORS2008] | |||||||||
| The water tower in downtown Stuart is 134 feet tall | [TC Palm] | |||||||||
|
||||||||||
|
||||||||||
|
||||||||||
![[Click for Map]](http://thurlowpa.com/StuartNorthofMonterey.jpg)