| <-- eyeonlakeo.com | Select Year --> | 2021 | 2020 | 2019 | 2018 | 2017 | ||||
| Select Structure-> | S-80 | S-308 | S-79 | S-77 | ||||||
| Query Inputs: | ||||||||||
| Start Date | 1/1/2016 | 20160101 | ||||||||
| End Date | 12/31/2016 | 20161231 | ||||||||
| Structure | S-308 at Port Mayaca | |||||||||
| DBKey | DJ239 | |||||||||
| Last Update | 11/1/2021 | 8:15 AM | ||||||||
| Summary of Query Results | ||||||||||
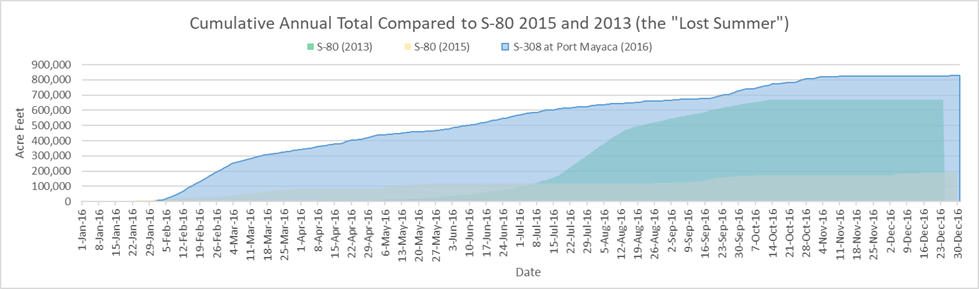
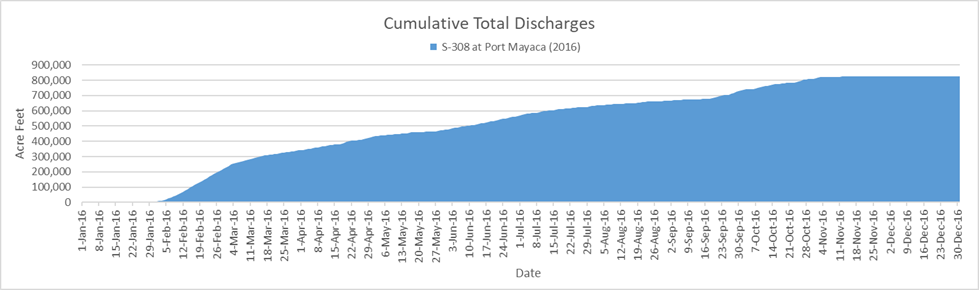
| Between January, 1, 2016 and December, 31, 2016, S-308 at Port Mayaca discharged 269,550,352,724 (269.55 billion) gallons of water at an average of 736,476,374 gallons per day. | ||||||||||
| - This is equal to 827,220 acre feet of water at an average of 2,260 acre feet per day. | ||||||||||
| - That amount would submerge the peninsula of Stuart, Florida north of Monterey Rd. under 346 feet of water. | ||||||||||
| - 346 feet is equal to 2.6 times the height of the water tower in downtown Stuart. | ||||||||||
| - This is equal to the volume of water that would be required to lower Lake Okeechobee by 21.26 inches (1.77 feet) | ||||||||||
| Query Results Table | (DATA NOT VERIFIED) | |||||||||
| Date | # | cubic feet | gallons | billion gallons | Acre Feet | Stuart Inches | Stuart Feet | Lake Inches | ||
| Start Date of query results | 1/1/2016 | |||||||||
| End Date of query results | 12/31/2016 | |||||||||
| Number of Days | 366 | |||||||||
| Number of Days Missing Data | - | |||||||||
| Last date with numerical data | 12/31/2016 | 0 | ||||||||
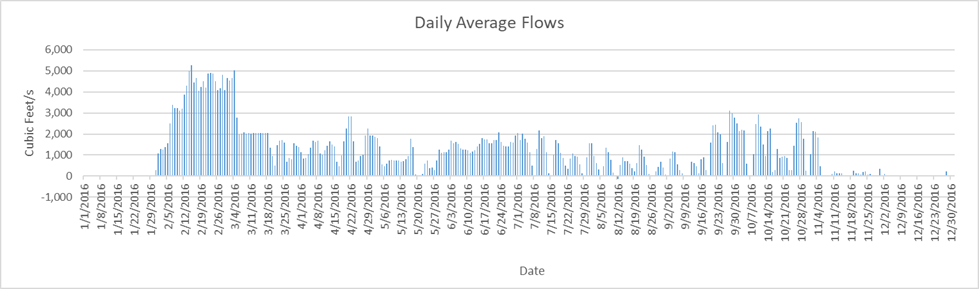
| Highest Flow Rate (per second)* | 2/14/2016 | 5,273 | 39,445 | |||||||
| Highest Flow Rate (per day)* | 2/14/2016 | 455,587,200 | 3,408,029,161 | 3.41 | 10,458.87 | 52.43 | 4.37 | 0.27 | ||
| Days of Highest Flow Rate | 1 | |||||||||
| Lowest Flow Rate (per second)* | 8/11/2016 | (137) | (1,025) | |||||||
| Lowest Flow Rate (per day)* | 8/11/2016 | (11,836,800) | (88,545,419) | (0.09) | (271.74) | (1.36) | (0.11) | |||
| Days of Lowest Flow Rate | 1 | |||||||||
| Average Flow Rate (per second) | 1,139.50 | 8,524 | ||||||||
| Average Flow Rate (per day) | 98,452,564 | 736,476,374 | 0.74 | 2,260.17 | 11.33 | 0.94 | 0.06 | |||
| Last Day with positive flow | 12/27/2016 | 19,526,400 | 146,067,626 | 0.15 | 448.27 | 2.25 | 0.19 | 0.01 | ||
| Last one day total | 12/31/2016 | 1 | - | - | - | - | - | - | - | |
| Last 7 days | 12/24/2016 | 7 | 19,526,400 | 146,067,626 | 0.15 | 448.27 | 2.25 | 0.19 | 0.01 | |
| Last 45 days | 11/16/2016 | 45 | 162,000,000 | 1,211,844,240 | 1.21 | 3,719.02 | 18.64 | 1.55 | 0.10 | |
| Last 90 days | 10/2/2016 | 90 | 4,162,838,400 | 31,140,195,908 | 31.14 | 95,565.84 | 479.11 | 39.93 | 2.46 | |
| Total Flow for 366 days | 36,033,638,400 | 269,550,352,724 | 269.55 | 827,220.41 | 4,147.16 | 345.60 | 21.26 | |||
| * = If there is more than one date of highest or lowest flow rate then the first date appears in the date column. | ||||||||||
| Stuart peninsula land area north of Monterey Rd = 3.74 sq miles or 2,393.6 acres | [Click for Map] | |||||||||
| Lake Okeechobee Average Surface Area = 467,000 acres (approx 730 sq mi). | [See LORS2008] | |||||||||
| The water tower in downtown Stuart is 134 feet tall | [TC Palm] | |||||||||
|
||||||||||
|
||||||||||
|
||||||||||
![[Click for Map]](http://thurlowpa.com/StuartNorthofMonterey.jpg)