| <-- eyeonlakeo.com | Select Year --> | 2021 | 2020 | 2019 | 2018 | 2017 | ||||
| Select Structure-> | S-80 | S-308 | S-79 | S-77 | ||||||
| Query Inputs: | ||||||||||
| Start Date | 1/1/2016 | 20160101 | ||||||||
| End Date | 12/31/2016 | 20161231 | ||||||||
| Structure | S-79 at Franklin Lock - Caloosahatchee | |||||||||
| DBKey | DJ237 | |||||||||
| Last Update | 11/1/2021 | 8:16 AM | ||||||||
| Summary of Query Results | ||||||||||
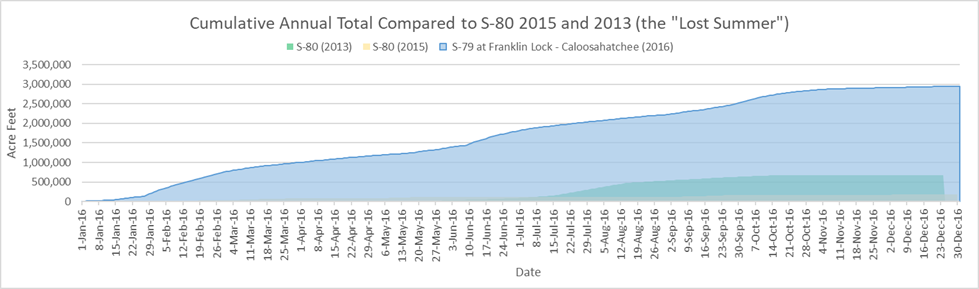
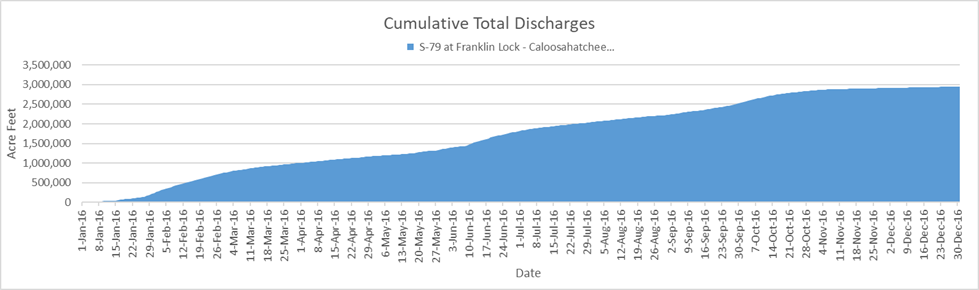
| Between January, 1, 2016 and December, 31, 2016, S-79 at Franklin Lock - Caloosahatchee discharged 961,561,241,217 (961.56 billion) gallons of water at an average of 2,634,414,359 gallons per day. | ||||||||||
| - This is equal to 2,950,926 acre feet of water at an average of 8,085 acre feet per day. | ||||||||||
| - That amount would submerge the peninsula of Stuart, Florida north of Monterey Rd. under 1,233 feet of water. | ||||||||||
| - 1,233 feet is equal to 9.2 times the height of the water tower in downtown Stuart. | ||||||||||
| - This is equal to the volume of water that would be required to lower Lake Okeechobee by 75.83 inches (6.32 feet) | ||||||||||
| Query Results Table | (DATA NOT VERIFIED) | |||||||||
| Date | # | cubic feet | gallons | billion gallons | Acre Feet | Stuart Inches | Stuart Feet | Lake Inches | ||
| Start Date of query results | 1/1/2016 | |||||||||
| End Date of query results | 12/31/2016 | |||||||||
| Number of Days | 366 | |||||||||
| Number of Days Missing Data | 1 | |||||||||
| Last date with numerical data | 12/31/2016 | 811 | ||||||||
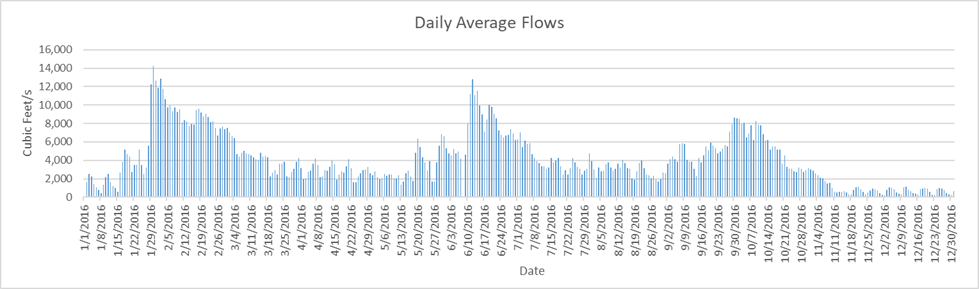
| Highest Flow Rate (per second)* | 1/29/2016 | 14,280 | 106,822 | |||||||
| Highest Flow Rate (per day)* | 1/29/2016 | 1,233,792,000 | 9,229,405,732 | 9.23 | 28,324.03 | 142.00 | 11.83 | 0.73 | ||
| Days of Highest Flow Rate | 1 | |||||||||
| Lowest Flow Rate (per second)* | 12/1/2016 | 234 | 1,750 | |||||||
| Lowest Flow Rate (per day)* | 12/1/2016 | 20,217,600 | 151,238,161 | 0.15 | 464.13 | 2.33 | 0.19 | |||
| Days of Lowest Flow Rate | 1 | |||||||||
| Average Flow Rate (per second) | 4,076.04 | 30,491 | ||||||||
| Average Flow Rate (per day) | 352,169,951 | 2,634,414,359 | 2.63 | 8,084.73 | 40.53 | 3.38 | 0.21 | |||
| Last Day with positive flow | 12/31/2016 | 70,070,400 | 524,163,029 | 0.52 | 1,608.60 | 8.06 | 0.67 | 0.04 | ||
| Last one day total | 12/31/2016 | 1 | 70,070,400 | 524,163,029 | 0.52 | 1,608.60 | 8.06 | 0.67 | 0.04 | |
| Last 7 days | 12/24/2016 | 7 | 447,897,600 | 3,350,506,955 | 3.35 | 10,282.34 | 51.55 | 4.30 | 0.26 | |
| Last 45 days | 11/16/2016 | 45 | 2,624,400,000 | 19,631,876,688 | 19.63 | 60,248.07 | 302.05 | 25.17 | 1.55 | |
| Last 90 days | 10/2/2016 | 90 | 17,758,828,800 | 132,845,274,015 | 132.85 | 407,687.55 | 2,043.89 | 170.32 | 10.48 | |
| Total Flow for 366 days | 128,542,032,000 | 961,561,241,217 | 961.56 | 2,950,925.78 | 14,794.08 | 1,232.84 | 75.83 | |||
| * = If there is more than one date of highest or lowest flow rate then the first date appears in the date column. | ||||||||||
| Stuart peninsula land area north of Monterey Rd = 3.74 sq miles or 2,393.6 acres | [Click for Map] | |||||||||
| Lake Okeechobee Average Surface Area = 467,000 acres (approx 730 sq mi). | [See LORS2008] | |||||||||
| The water tower in downtown Stuart is 134 feet tall | [TC Palm] | |||||||||
|
||||||||||
|
||||||||||
|
||||||||||
![[Click for Map]](http://thurlowpa.com/StuartNorthofMonterey.jpg)