| <-- eyeonlakeo.com | Select Year --> | 2021 | 2020 | 2019 | 2018 | 2017 | ||||
| Select Structure-> | S-80 | S-308 | S-79 | S-77 | ||||||
| Query Inputs: | ||||||||||
| Start Date | 1/1/2016 | 20160101 | ||||||||
| End Date | 12/31/2016 | 20161231 | ||||||||
| Structure | S-77 at Moore Haven - Caloosahatchee | |||||||||
| DBKey | DJ235 | |||||||||
| Last Update | 11/1/2021 | 8:16 AM | ||||||||
| Summary of Query Results | ||||||||||
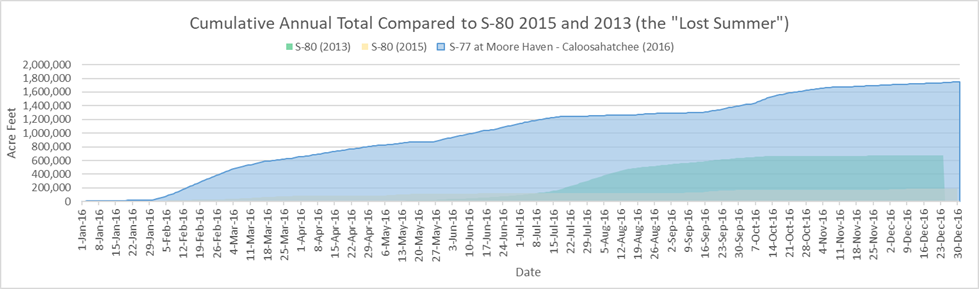
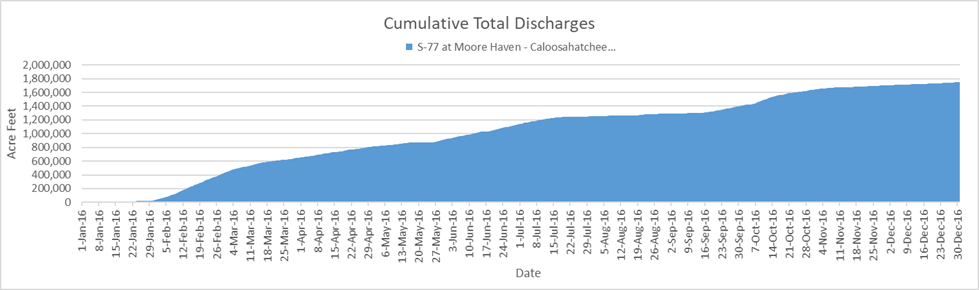
| Between January, 1, 2016 and December, 31, 2016, S-77 at Moore Haven - Caloosahatchee discharged 569,903,523,919 (569.9 billion) gallons of water at an average of 1,578,680,122 gallons per day. | ||||||||||
| - This is equal to 1,748,971 acre feet of water at an average of 4,845 acre feet per day. | ||||||||||
| - That amount would submerge the peninsula of Stuart, Florida north of Monterey Rd. under 731 feet of water. | ||||||||||
| - 731 feet is equal to 5.5 times the height of the water tower in downtown Stuart. | ||||||||||
| - This is equal to the volume of water that would be required to lower Lake Okeechobee by 44.94 inches (3.75 feet) | ||||||||||
| Query Results Table | (DATA NOT VERIFIED) | |||||||||
| Date | # | cubic feet | gallons | billion gallons | Acre Feet | Stuart Inches | Stuart Feet | Lake Inches | ||
| Start Date of query results | 1/1/2016 | |||||||||
| End Date of query results | 12/31/2016 | |||||||||
| Number of Days | 366 | |||||||||
| Number of Days Missing Data | 5 | |||||||||
| Last date with numerical data | 12/31/2016 | 905 | ||||||||
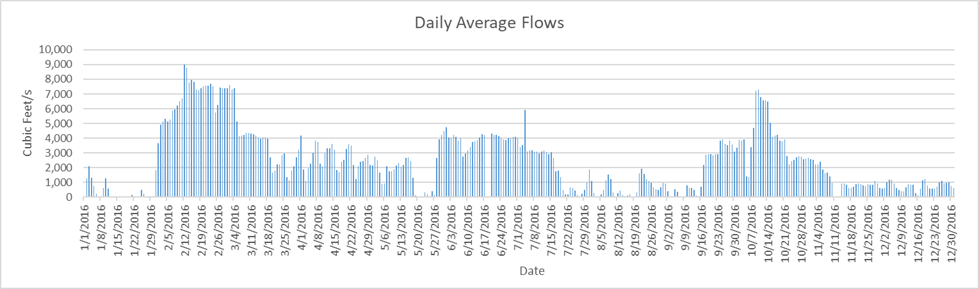
| Highest Flow Rate (per second)* | 2/11/2016 | 8,984 | 67,205 | |||||||
| Highest Flow Rate (per day)* | 2/11/2016 | 776,217,600 | 5,806,511,281 | 5.81 | 17,819.55 | 89.34 | 7.44 | 0.46 | ||
| Days of Highest Flow Rate | 1 | |||||||||
| Lowest Flow Rate (per second)* | 1/6/2016 | - | - | |||||||
| Lowest Flow Rate (per day)* | 1/6/2016 | - | - | - | - | - | - | |||
| Days of Lowest Flow Rate | 34 | |||||||||
| Average Flow Rate (per second) | 2,442.58 | 18,272 | ||||||||
| Average Flow Rate (per day) | 211,038,821 | 1,578,680,122 | 1.58 | 4,844.80 | 24.29 | 2.02 | 0.12 | |||
| Last Day with positive flow | 12/31/2016 | 78,192,000 | 584,916,820 | 0.58 | 1,795.05 | 9.00 | 0.75 | 0.05 | ||
| Last one day total | 12/31/2016 | 1 | 78,192,000 | 584,916,820 | 0.58 | 1,795.05 | 9.00 | 0.75 | 0.05 | |
| Last 7 days | 12/24/2016 | 7 | 627,955,200 | 4,697,431,433 | 4.70 | 14,415.90 | 72.27 | 6.02 | 0.37 | |
| Last 45 days | 11/16/2016 | 45 | 3,113,942,400 | 23,293,908,402 | 23.29 | 71,486.45 | 358.39 | 29.87 | 1.84 | |
| Last 90 days | 10/2/2016 | 90 | 14,950,483,200 | 111,837,388,587 | 111.84 | 343,216.66 | 1,720.67 | 143.39 | 8.82 | |
| Total Flow for 366 days | 76,185,014,400 | 569,903,523,919 | 569.90 | 1,748,971.29 | 8,768.24 | 730.69 | 44.94 | |||
| * = If there is more than one date of highest or lowest flow rate then the first date appears in the date column. | ||||||||||
| Stuart peninsula land area north of Monterey Rd = 3.74 sq miles or 2,393.6 acres | [Click for Map] | |||||||||
| Lake Okeechobee Average Surface Area = 467,000 acres (approx 730 sq mi). | [See LORS2008] | |||||||||
| The water tower in downtown Stuart is 134 feet tall | [TC Palm] | |||||||||
|
||||||||||
|
||||||||||
|
||||||||||
![[Click for Map]](http://thurlowpa.com/StuartNorthofMonterey.jpg)