| <-- eyeonlakeo.com | Select Year --> | 2021 | 2020 | 2019 | 2018 | 2017 | ||||
| Select Structure-> | S-80 | S-308 | S-79 | S-77 | ||||||
| Query Inputs: | ||||||||||
| Start Date | 1/1/2016 | 20160101 | ||||||||
| End Date | 12/31/2016 | 20161231 | ||||||||
| Structure | S-80 at the St. Lucie Canal | |||||||||
| DBKey | DJ238 | |||||||||
| Last Update | 11/1/2021 | 8:15 AM | ||||||||
| Summary of Query Results | ||||||||||
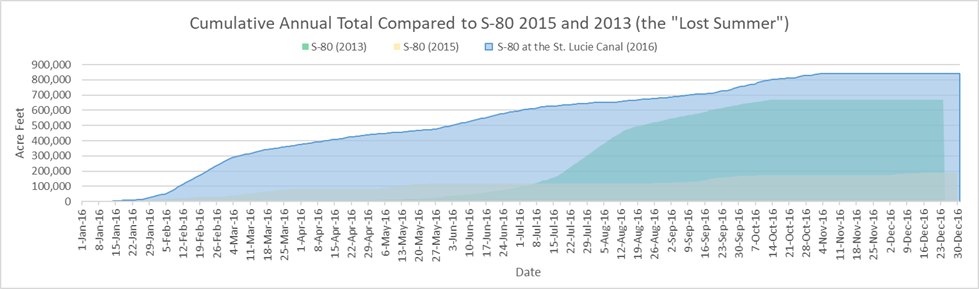
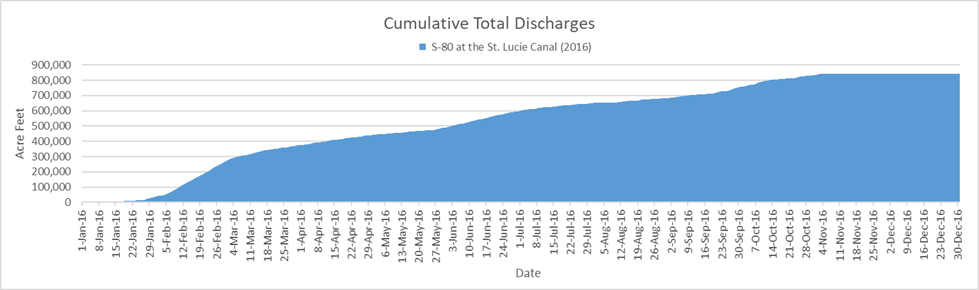
| Between January, 1, 2016 and December, 31, 2016, S-80 at the St. Lucie Canal discharged 274,618,123,756 (274.62 billion) gallons of water at an average of 769,238,442 gallons per day. | ||||||||||
| - This is equal to 842,773 acre feet of water at an average of 2,361 acre feet per day. | ||||||||||
| - That amount would submerge the peninsula of Stuart, Florida north of Monterey Rd. under 352 feet of water. | ||||||||||
| - 352 feet is equal to 2.6 times the height of the water tower in downtown Stuart. | ||||||||||
| - This is equal to the volume of water that would be required to lower Lake Okeechobee by 21.66 inches (1.8 feet) | ||||||||||
| Query Results Table | (DATA NOT VERIFIED) | |||||||||
| Date | # | cubic feet | gallons | billion gallons | Acre Feet | Stuart Inches | Stuart Feet | Lake Inches | ||
| Start Date of query results | 1/1/2016 | |||||||||
| End Date of query results | 12/31/2016 | |||||||||
| Number of Days | 366 | |||||||||
| Number of Days Missing Data | 9 | |||||||||
| Last date with numerical data | 12/31/2016 | 0 | ||||||||
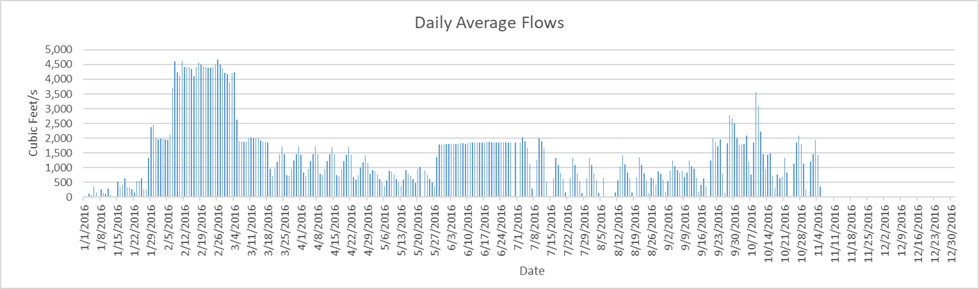
| Highest Flow Rate (per second)* | 2/25/2016 | 4,676 | 34,979 | |||||||
| Highest Flow Rate (per day)* | 2/25/2016 | 404,006,400 | 3,022,177,955 | 3.02 | 9,274.73 | 46.50 | 3.87 | 0.24 | ||
| Days of Highest Flow Rate | 1 | |||||||||
| Lowest Flow Rate (per second)* | 1/1/2016 | - | - | |||||||
| Lowest Flow Rate (per day)* | 1/1/2016 | - | - | - | - | - | - | |||
| Days of Lowest Flow Rate | 70 | |||||||||
| Average Flow Rate (per second) | 1,190.19 | 8,903 | ||||||||
| Average Flow Rate (per day) | 102,832,215 | 769,238,442 | 0.77 | 2,360.71 | 11.84 | 0.99 | 0.06 | |||
| Last Day with positive flow | 11/4/2016 | 31,104,000 | 232,674,094 | 0.23 | 714.05 | 3.58 | 0.30 | 0.02 | ||
| Last one day total | 12/31/2016 | 1 | - | - | - | - | - | - | - | |
| Last 7 days | 12/24/2016 | 7 | - | - | - | - | - | - | - | |
| Last 45 days | 11/16/2016 | 45 | - | - | - | - | - | - | - | |
| Last 90 days | 10/2/2016 | 90 | 3,780,604,800 | 28,280,889,818 | 28.28 | 86,790.94 | 435.12 | 36.26 | 2.23 | |
| Total Flow for 366 days | 36,711,100,800 | 274,618,123,756 | 274.62 | 842,772.84 | 4,225.13 | 352.09 | 21.66 | |||
| * = If there is more than one date of highest or lowest flow rate then the first date appears in the date column. | ||||||||||
| Stuart peninsula land area north of Monterey Rd = 3.74 sq miles or 2,393.6 acres | [Click for Map] | |||||||||
| Lake Okeechobee Average Surface Area = 467,000 acres (approx 730 sq mi). | [See LORS2008] | |||||||||
| The water tower in downtown Stuart is 134 feet tall | [TC Palm] | |||||||||
|
||||||||||
|
||||||||||
|
||||||||||
![[Click for Map]](http://thurlowpa.com/StuartNorthofMonterey.jpg)