| <-- eyeonlakeo.com | Select Year --> | 2021 | 2020 | 2019 | 2018 | 2017 | ||||
| Select Structure-> | S-80 | S-308 | S-79 | S-77 | ||||||
| Query Inputs: | ||||||||||
| Start Date | 1/1/2019 | 20190101 | ||||||||
| End Date | 12/31/2019 | 20191231 | ||||||||
| Structure | S-77 at Moore Haven - Caloosahatchee | |||||||||
| DBKey | DJ235 | |||||||||
| Last Update | 11/1/2021 | 7:24 AM | ||||||||
| Summary of Query Results | ||||||||||
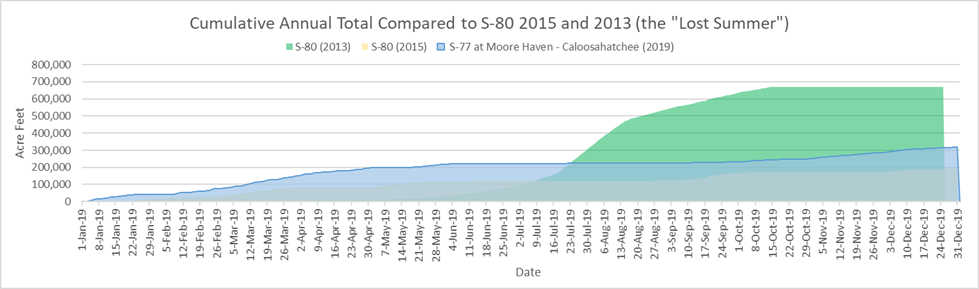
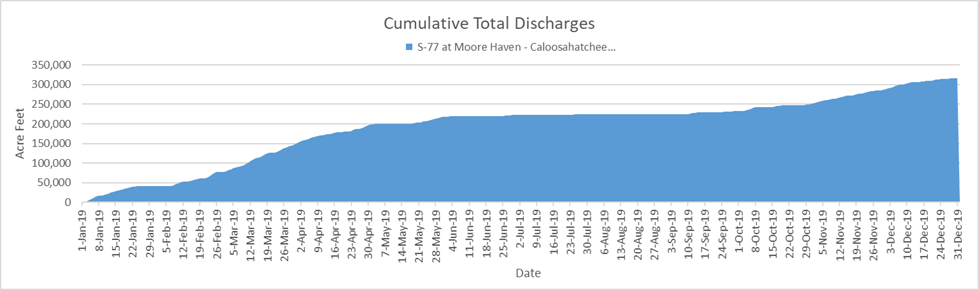
| Between January, 1, 2019 and December, 31, 2019, S-77 at Moore Haven - Caloosahatchee discharged 103,238,723,545 (103.24 billion) gallons of water at an average of 282,845,818 gallons per day. | ||||||||||
| - This is equal to 316,828 acre feet of water at an average of 868 acre feet per day. | ||||||||||
| - That amount would submerge the peninsula of Stuart, Florida north of Monterey Rd. under 132 feet of water. | ||||||||||
| - 132 feet is equal to 98.8% the height of the water tower in downtown Stuart. | ||||||||||
| - This is equal to the volume of water that would be required to lower Lake Okeechobee by 8.14 inches (.68 feet) | ||||||||||
| Query Results Table | (DATA NOT VERIFIED) | |||||||||
| Date | # | cubic feet | gallons | billion gallons | Acre Feet | Stuart Inches | Stuart Feet | Lake Inches | ||
| Start Date of query results | 1/1/2019 | |||||||||
| End Date of query results | 12/31/2019 | |||||||||
| Number of Days | 365 | |||||||||
| Number of Days Missing Data | - | |||||||||
| Last date with numerical data | 12/31/2019 | 88 | ||||||||
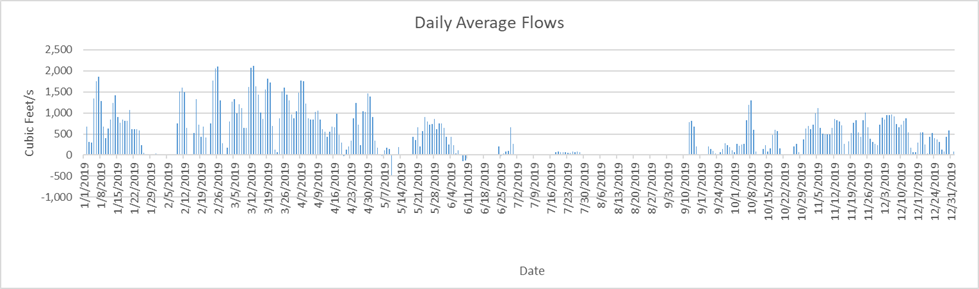
| Highest Flow Rate (per second)* | 3/12/2019 | 2,121 | 15,866 | |||||||
| Highest Flow Rate (per day)* | 3/12/2019 | 183,254,400 | 1,370,838,204 | 1.37 | 4,206.95 | 21.09 | 1.76 | 0.11 | ||
| Days of Highest Flow Rate | 1 | |||||||||
| Lowest Flow Rate (per second)* | 5/9/2019 | (472) | (3,531) | |||||||
| Lowest Flow Rate (per day)* | 5/9/2019 | (40,780,800) | (305,061,590) | (0.31) | (936.20) | (4.69) | (0.39) | |||
| Days of Lowest Flow Rate | 1 | |||||||||
| Average Flow Rate (per second) | 437.63 | 3,274 | ||||||||
| Average Flow Rate (per day) | 37,810,983 | 282,845,818 | 0.28 | 868.02 | 4.35 | 0.36 | 0.02 | |||
| Last Day with positive flow | 12/31/2019 | 7,603,200 | 56,875,890 | 0.06 | 174.55 | 0.88 | 0.07 | 0.00 | ||
| Last one day total | 12/31/2019 | 1 | 7,603,200 | 56,875,890 | 0.06 | 174.55 | 0.88 | 0.07 | 0.00 | |
| Last 7 days | 12/24/2019 | 7 | 171,322,560 | 1,281,581,837 | 1.28 | 3,933.03 | 19.72 | 1.64 | 0.10 | |
| Last 45 days | 11/16/2019 | 45 | 1,987,104,960 | 14,864,578,395 | 14.86 | 45,617.76 | 228.70 | 19.06 | 1.17 | |
| Last 90 days | 10/2/2019 | 90 | 3,673,546,560 | 27,480,038,513 | 27.48 | 84,333.22 | 422.79 | 35.23 | 2.17 | |
| Total Flow for 365 days | 13,801,008,960 | 103,238,723,545 | 103.24 | 316,828.30 | 1,588.38 | 132.36 | 8.14 | |||
| * = If there is more than one date of highest or lowest flow rate then the first date appears in the date column. | ||||||||||
| Stuart peninsula land area north of Monterey Rd = 3.74 sq miles or 2,393.6 acres | [Click for Map] | |||||||||
| Lake Okeechobee Average Surface Area = 467,000 acres (approx 730 sq mi). | [See LORS2008] | |||||||||
| The water tower in downtown Stuart is 134 feet tall | [TC Palm] | |||||||||
|
||||||||||
|
||||||||||
|
||||||||||
![[Click for Map]](http://thurlowpa.com/StuartNorthofMonterey.jpg)