| <-- eyeonlakeo.com | Select Year --> | 2021 | 2020 | 2019 | 2018 | 2017 | ||||
| Select Structure-> | S-80 | S-308 | S-79 | S-77 | ||||||
| Query Inputs: | ||||||||||
| Start Date | 1/1/2020 | 20200101 | ||||||||
| End Date | 12/31/2020 | 20201231 | ||||||||
| Structure | S-77 at Moore Haven - Caloosahatchee | |||||||||
| DBKey | DJ235 | |||||||||
| Last Update | 11/1/2021 | 7:23 AM | ||||||||
| Summary of Query Results | ||||||||||
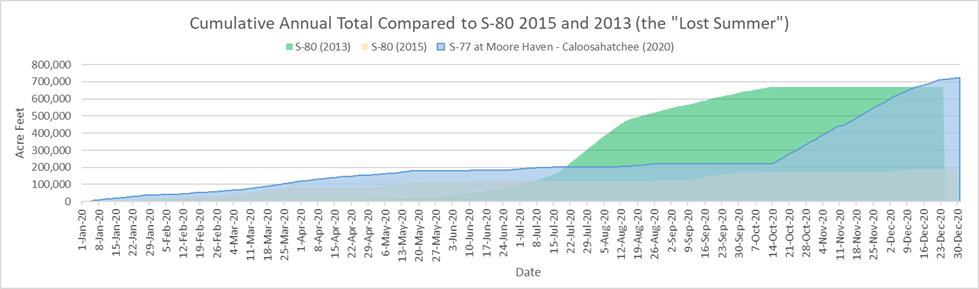
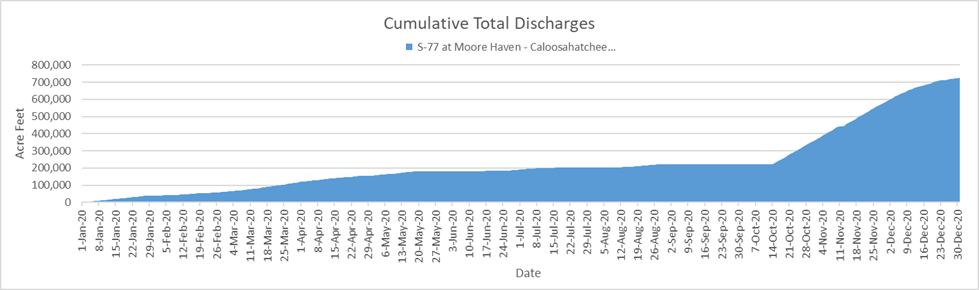
| Between January, 1, 2020 and December, 31, 2020, S-77 at Moore Haven - Caloosahatchee discharged 236,112,952,559 (236.11 billion) gallons of water at an average of 645,117,357 gallons per day. | ||||||||||
| - This is equal to 724,605 acre feet of water at an average of 1,980 acre feet per day. | ||||||||||
| - That amount would submerge the peninsula of Stuart, Florida north of Monterey Rd. under 303 feet of water. | ||||||||||
| - 303 feet is equal to 2.3 times the height of the water tower in downtown Stuart. | ||||||||||
| - This is equal to the volume of water that would be required to lower Lake Okeechobee by 18.62 inches (1.55 feet) | ||||||||||
| Query Results Table | (DATA NOT VERIFIED) | |||||||||
| Date | # | cubic feet | gallons | billion gallons | Acre Feet | Stuart Inches | Stuart Feet | Lake Inches | ||
| Start Date of query results | 1/1/2020 | |||||||||
| End Date of query results | 12/31/2020 | |||||||||
| Number of Days | 366 | |||||||||
| Number of Days Missing Data | - | |||||||||
| Last date with numerical data | 12/31/2020 | 813 | ||||||||
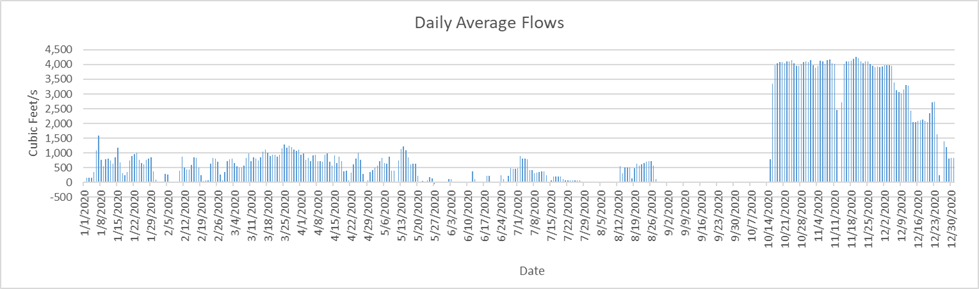
| Highest Flow Rate (per second)* | 11/19/2020 | 4,264 | 31,897 | |||||||
| Highest Flow Rate (per day)* | 11/19/2020 | 368,409,600 | 2,755,895,381 | 2.76 | 8,457.54 | 42.40 | 3.53 | 0.22 | ||
| Days of Highest Flow Rate | 1 | |||||||||
| Lowest Flow Rate (per second)* | 5/26/2020 | (53) | (396) | |||||||
| Lowest Flow Rate (per day)* | 5/26/2020 | (4,579,200) | (34,254,797) | (0.03) | (105.12) | (0.53) | (0.04) | |||
| Days of Lowest Flow Rate | 1 | |||||||||
| Average Flow Rate (per second) | 998.14 | 7,467 | ||||||||
| Average Flow Rate (per day) | 86,239,641 | 645,117,357 | 0.65 | 1,979.79 | 9.93 | 0.83 | 0.05 | |||
| Last Day with positive flow | 12/31/2020 | 70,243,200 | 525,455,662 | 0.53 | 1,612.57 | 8.08 | 0.67 | 0.04 | ||
| Last one day total | 12/31/2020 | 1 | 70,243,200 | 525,455,662 | 0.53 | 1,612.57 | 8.08 | 0.67 | 0.04 | |
| Last 7 days | 12/24/2020 | 7 | 529,545,600 | 3,961,276,452 | 3.96 | 12,156.72 | 60.95 | 5.08 | 0.31 | |
| Last 45 days | 11/16/2020 | 45 | 11,372,054,400 | 85,068,880,380 | 85.07 | 261,067.05 | 1,308.83 | 109.07 | 6.71 | |
| Last 90 days | 10/2/2020 | 90 | 21,982,406,400 | 164,439,830,723 | 164.44 | 504,647.77 | 2,529.99 | 210.83 | 12.97 | |
| Total Flow for 366 days | 31,563,708,480 | 236,112,952,559 | 236.11 | 724,604.70 | 3,632.71 | 302.73 | 18.62 | |||
| * = If there is more than one date of highest or lowest flow rate then the first date appears in the date column. | ||||||||||
| Stuart peninsula land area north of Monterey Rd = 3.74 sq miles or 2,393.6 acres | [Click for Map] | |||||||||
| Lake Okeechobee Average Surface Area = 467,000 acres (approx 730 sq mi). | [See LORS2008] | |||||||||
| The water tower in downtown Stuart is 134 feet tall | [TC Palm] | |||||||||
|
||||||||||
|
||||||||||
|
||||||||||
![[Click for Map]](http://thurlowpa.com/StuartNorthofMonterey.jpg)