| <-- eyeonlakeo.com | Select Year --> | 2021 | 2020 | 2019 | 2018 | 2017 | ||||
| Select Structure-> | S-80 | S-308 | S-79 | S-77 | ||||||
| Query Inputs: | ||||||||||
| Start Date | 1/1/2018 | 20180101 | ||||||||
| End Date | 12/31/2018 | 20181231 | ||||||||
| Structure | S-77 at Moore Haven - Caloosahatchee | |||||||||
| DBKey | DJ235 | |||||||||
| Last Update | 11/1/2021 | 7:24 AM | ||||||||
| Summary of Query Results | ||||||||||
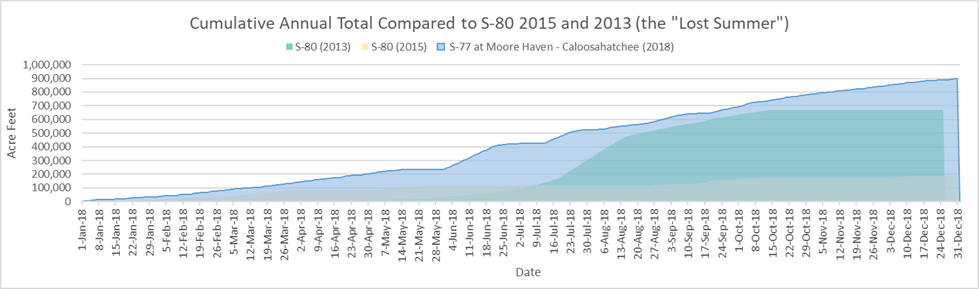
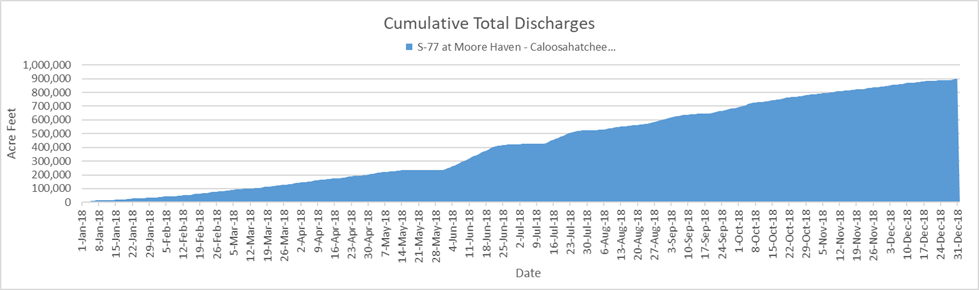
| Between January, 1, 2018 and December, 31, 2018, S-77 at Moore Haven - Caloosahatchee discharged 292,819,571,819 (292.82 billion) gallons of water at an average of 802,245,402 gallons per day. | ||||||||||
| - This is equal to 898,631 acre feet of water at an average of 2,462 acre feet per day. | ||||||||||
| - That amount would submerge the peninsula of Stuart, Florida north of Monterey Rd. under 375 feet of water. | ||||||||||
| - 375 feet is equal to 2.8 times the height of the water tower in downtown Stuart. | ||||||||||
| - This is equal to the volume of water that would be required to lower Lake Okeechobee by 23.09 inches (1.92 feet) | ||||||||||
| Query Results Table | (DATA NOT VERIFIED) | |||||||||
| Date | # | cubic feet | gallons | billion gallons | Acre Feet | Stuart Inches | Stuart Feet | Lake Inches | ||
| Start Date of query results | 1/1/2018 | |||||||||
| End Date of query results | 12/31/2018 | |||||||||
| Number of Days | 365 | |||||||||
| Number of Days Missing Data | - | |||||||||
| Last date with numerical data | 12/31/2018 | 1248 | ||||||||
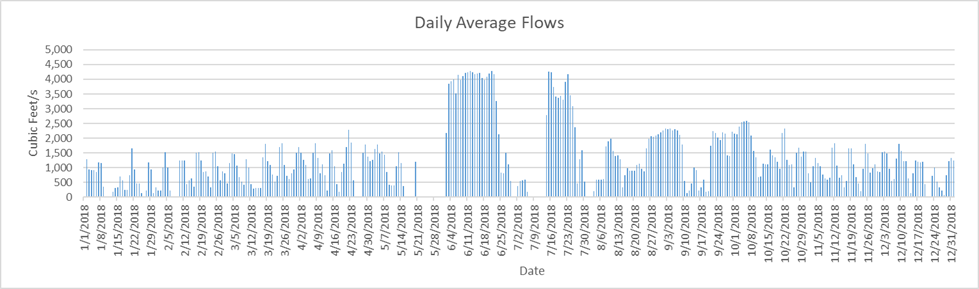
| Highest Flow Rate (per second)* | 6/11/2018 | 4,288 | 32,076 | |||||||
| Highest Flow Rate (per day)* | 6/11/2018 | 370,483,200 | 2,771,406,987 | 2.77 | 8,505.14 | 42.64 | 3.55 | 0.22 | ||
| Days of Highest Flow Rate | 1 | |||||||||
| Lowest Flow Rate (per second)* | 1/9/2018 | - | - | |||||||
| Lowest Flow Rate (per day)* | 1/9/2018 | - | - | - | - | - | - | |||
| Days of Lowest Flow Rate | 38 | |||||||||
| Average Flow Rate (per second) | 1,241.26 | 9,285 | ||||||||
| Average Flow Rate (per day) | 107,244,604 | 802,245,402 | 0.80 | 2,462.00 | 12.34 | 1.03 | 0.06 | |||
| Last Day with positive flow | 12/31/2018 | 107,827,200 | 806,603,526 | 0.81 | 2,475.38 | 12.41 | 1.03 | 0.06 | ||
| Last one day total | 12/31/2018 | 1 | 107,827,200 | 806,603,526 | 0.81 | 2,475.38 | 12.41 | 1.03 | 0.06 | |
| Last 7 days | 12/24/2018 | 7 | 491,529,600 | 3,676,897,003 | 3.68 | 11,283.99 | 56.57 | 4.71 | 0.29 | |
| Last 45 days | 11/16/2018 | 45 | 3,737,404,800 | 27,957,731,354 | 27.96 | 85,799.21 | 430.14 | 35.85 | 2.20 | |
| Last 90 days | 10/2/2018 | 90 | 8,906,284,800 | 66,623,641,572 | 66.62 | 204,460.63 | 1,025.04 | 85.42 | 5.25 | |
| Total Flow for 365 days | 39,144,280,320 | 292,819,571,819 | 292.82 | 898,631.09 | 4,505.17 | 375.43 | 23.09 | |||
| * = If there is more than one date of highest or lowest flow rate then the first date appears in the date column. | ||||||||||
| Stuart peninsula land area north of Monterey Rd = 3.74 sq miles or 2,393.6 acres | [Click for Map] | |||||||||
| Lake Okeechobee Average Surface Area = 467,000 acres (approx 730 sq mi). | [See LORS2008] | |||||||||
| The water tower in downtown Stuart is 134 feet tall | [TC Palm] | |||||||||
|
||||||||||
|
||||||||||
|
||||||||||
![[Click for Map]](http://thurlowpa.com/StuartNorthofMonterey.jpg)