| <-- eyeonlakeo.com | Select Year --> | 2021 | 2020 | 2019 | 2018 | 2017 | ||||
| Select Structure-> | S-80 | S-308 | S-79 | S-77 | ||||||
| Query Inputs: | ||||||||||
| Start Date | 1/1/2018 | 20180101 | ||||||||
| End Date | 12/31/2018 | 20181231 | ||||||||
| Structure | S-80 at the St. Lucie Canal | |||||||||
| DBKey | DJ238 | |||||||||
| Last Update | 11/1/2021 | 7:19 AM | ||||||||
| Summary of Query Results | ||||||||||
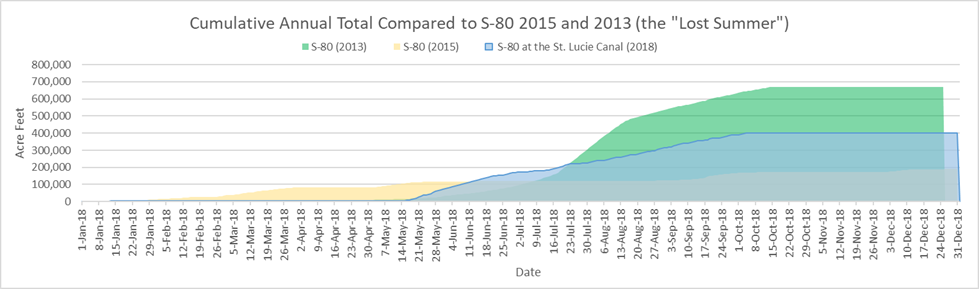
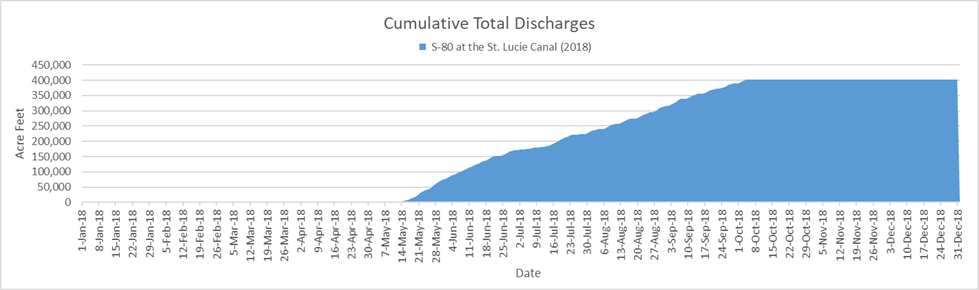
| Between January, 1, 2018 and December, 31, 2018, S-80 at the St. Lucie Canal discharged 131,029,769,764 (131.03 billion) gallons of water at an average of 358,985,671 gallons per day. | ||||||||||
| - This is equal to 402,116 acre feet of water at an average of 1,102 acre feet per day. | ||||||||||
| - That amount would submerge the peninsula of Stuart, Florida north of Monterey Rd. under 168 feet of water. | ||||||||||
| - 168 feet is equal to 1.3 times the height of the water tower in downtown Stuart. | ||||||||||
| - This is equal to the volume of water that would be required to lower Lake Okeechobee by 10.33 inches (.86 feet) | ||||||||||
| Query Results Table | (DATA NOT VERIFIED) | |||||||||
| Date | # | cubic feet | gallons | billion gallons | Acre Feet | Stuart Inches | Stuart Feet | Lake Inches | ||
| Start Date of query results | 1/1/2018 | |||||||||
| End Date of query results | 12/31/2018 | |||||||||
| Number of Days | 365 | |||||||||
| Number of Days Missing Data | - | |||||||||
| Last date with numerical data | 12/31/2018 | 0 | ||||||||
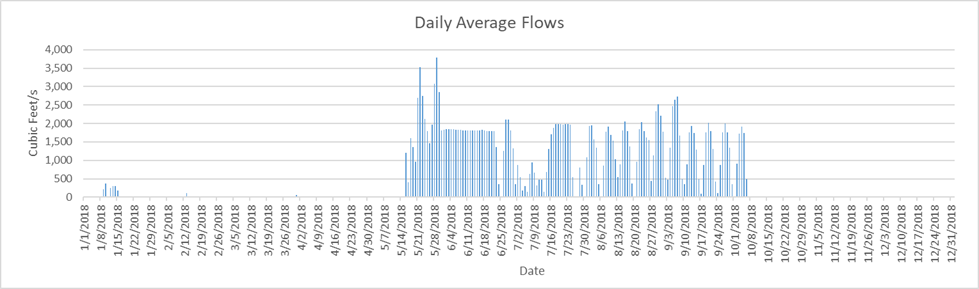
| Highest Flow Rate (per second)* | 5/28/2018 | 3,792 | 28,366 | |||||||
| Highest Flow Rate (per day)* | 5/28/2018 | 327,628,800 | 2,450,833,791 | 2.45 | 7,521.34 | 37.71 | 3.14 | 0.19 | ||
| Days of Highest Flow Rate | 1 | |||||||||
| Lowest Flow Rate (per second)* | 1/1/2018 | - | - | |||||||
| Lowest Flow Rate (per day)* | 1/1/2018 | - | - | - | - | - | - | |||
| Days of Lowest Flow Rate | 220 | |||||||||
| Average Flow Rate (per second) | 555.43 | 4,155 | ||||||||
| Average Flow Rate (per day) | 47,989,401 | 358,985,671 | 0.36 | 1,101.69 | 5.52 | 0.46 | 0.03 | |||
| Last Day with positive flow | 10/5/2018 | 41,817,600 | 312,817,393 | 0.31 | 960.00 | 4.81 | 0.40 | 0.02 | ||
| Last one day total | 12/31/2018 | 1 | - | - | - | - | - | - | - | |
| Last 7 days | 12/24/2018 | 7 | - | - | - | - | - | - | - | |
| Last 45 days | 11/16/2018 | 45 | - | - | - | - | - | - | - | |
| Last 90 days | 10/2/2018 | 90 | 505,180,800 | 3,779,015,078 | 3.78 | 11,597.38 | 58.14 | 4.85 | 0.30 | |
| Total Flow for 365 days | 17,516,131,200 | 131,029,769,764 | 131.03 | 402,115.96 | 2,015.96 | 168.00 | 10.33 | |||
| * = If there is more than one date of highest or lowest flow rate then the first date appears in the date column. | ||||||||||
| Stuart peninsula land area north of Monterey Rd = 3.74 sq miles or 2,393.6 acres | [Click for Map] | |||||||||
| Lake Okeechobee Average Surface Area = 467,000 acres (approx 730 sq mi). | [See LORS2008] | |||||||||
| The water tower in downtown Stuart is 134 feet tall | [TC Palm] | |||||||||
|
||||||||||
|
||||||||||
|
||||||||||
![[Click for Map]](http://thurlowpa.com/StuartNorthofMonterey.jpg)