| <-- eyeonlakeo.com | Select Year --> | 2021 | 2020 | 2019 | 2018 | 2017 | ||||
| Select Structure-> | S-80 | S-308 | S-79 | S-77 | ||||||
| Query Inputs: | ||||||||||
| Start Date | 1/1/2019 | 20190101 | ||||||||
| End Date | 12/31/2019 | 20191231 | ||||||||
| Structure | S-80 at the St. Lucie Canal | |||||||||
| DBKey | DJ238 | |||||||||
| Last Update | 11/1/2021 | 7:19 AM | ||||||||
| Summary of Query Results | ||||||||||
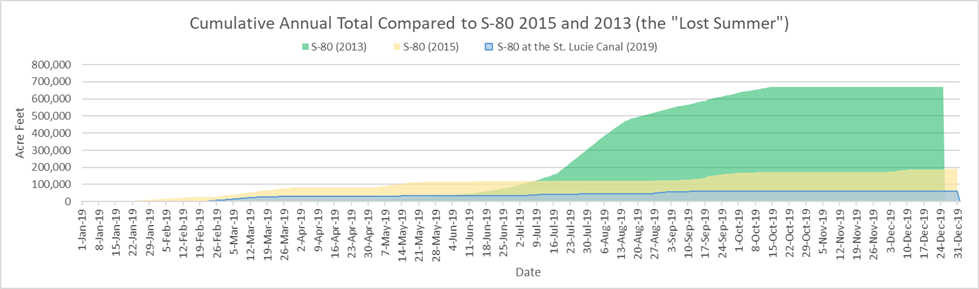
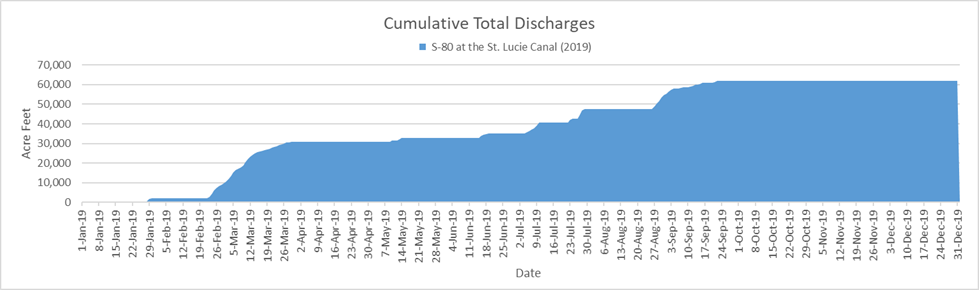
| Between January, 1, 2019 and December, 31, 2019, S-80 at the St. Lucie Canal discharged 20,175,429,224 (20.18 billion) gallons of water at an average of 55,275,149 gallons per day. | ||||||||||
| - This is equal to 61,916 acre feet of water at an average of 170 acre feet per day. | ||||||||||
| - That amount would submerge the peninsula of Stuart, Florida north of Monterey Rd. under 26 feet of water. | ||||||||||
| - 26 feet is equal to 19.3% the height of the water tower in downtown Stuart. | ||||||||||
| - This is equal to the volume of water that would be required to lower Lake Okeechobee by 1.59 inches (.13 feet) | ||||||||||
| Query Results Table | (DATA NOT VERIFIED) | |||||||||
| Date | # | cubic feet | gallons | billion gallons | Acre Feet | Stuart Inches | Stuart Feet | Lake Inches | ||
| Start Date of query results | 1/1/2019 | |||||||||
| End Date of query results | 12/31/2019 | |||||||||
| Number of Days | 365 | |||||||||
| Number of Days Missing Data | - | |||||||||
| Last date with numerical data | 12/31/2019 | 0 | ||||||||
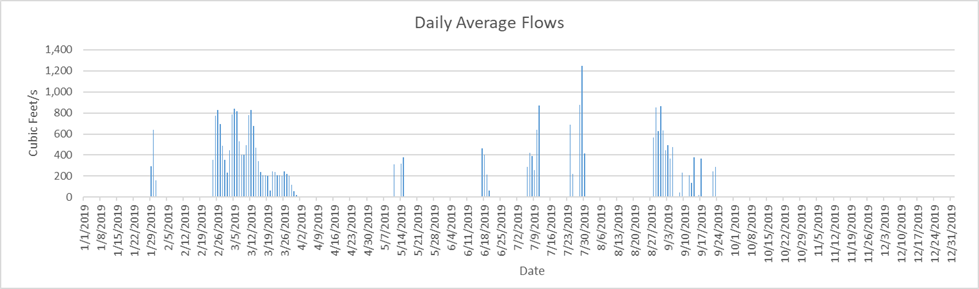
| Highest Flow Rate (per second)* | 7/28/2019 | 1,246 | 9,321 | |||||||
| Highest Flow Rate (per day)* | 7/28/2019 | 107,654,400 | 805,310,892 | 0.81 | 2,471.41 | 12.39 | 1.03 | 0.06 | ||
| Days of Highest Flow Rate | 1 | |||||||||
| Lowest Flow Rate (per second)* | 1/1/2019 | - | - | |||||||
| Lowest Flow Rate (per day)* | 1/1/2019 | - | - | - | - | - | - | |||
| Days of Lowest Flow Rate | 290 | |||||||||
| Average Flow Rate (per second) | 85.52 | 640 | ||||||||
| Average Flow Rate (per day) | 7,389,212 | 55,275,149 | 0.06 | 169.63 | 0.85 | 0.07 | 0.00 | |||
| Last Day with positive flow | 9/22/2019 | 24,883,200 | 186,139,275 | 0.19 | 571.24 | 2.86 | 0.24 | 0.01 | ||
| Last one day total | 12/31/2019 | 1 | - | - | - | - | - | - | - | |
| Last 7 days | 12/24/2019 | 7 | - | - | - | - | - | - | - | |
| Last 45 days | 11/16/2019 | 45 | - | - | - | - | - | - | - | |
| Last 90 days | 10/2/2019 | 90 | - | - | - | - | - | - | - | |
| Total Flow for 365 days | 2,697,062,400 | 20,175,429,224 | 20.18 | 61,916.18 | 310.41 | 25.87 | 1.59 | |||
| * = If there is more than one date of highest or lowest flow rate then the first date appears in the date column. | ||||||||||
| Stuart peninsula land area north of Monterey Rd = 3.74 sq miles or 2,393.6 acres | [Click for Map] | |||||||||
| Lake Okeechobee Average Surface Area = 467,000 acres (approx 730 sq mi). | [See LORS2008] | |||||||||
| The water tower in downtown Stuart is 134 feet tall | [TC Palm] | |||||||||
|
||||||||||
|
||||||||||
|
||||||||||
![[Click for Map]](http://thurlowpa.com/StuartNorthofMonterey.jpg)