| <-- eyeonlakeo.com | Select Year --> | 2021 | 2020 | 2019 | 2018 | 2017 | ||||
| Select Structure-> | S-80 | S-308 | S-79 | S-77 | ||||||
| Query Inputs: | ||||||||||
| Start Date | 1/1/2020 | 20200101 | ||||||||
| End Date | 12/31/2020 | 20201231 | ||||||||
| Structure | S-80 at the St. Lucie Canal | |||||||||
| DBKey | DJ238 | |||||||||
| Last Update | 11/1/2021 | 7:19 AM | ||||||||
| Summary of Query Results | ||||||||||
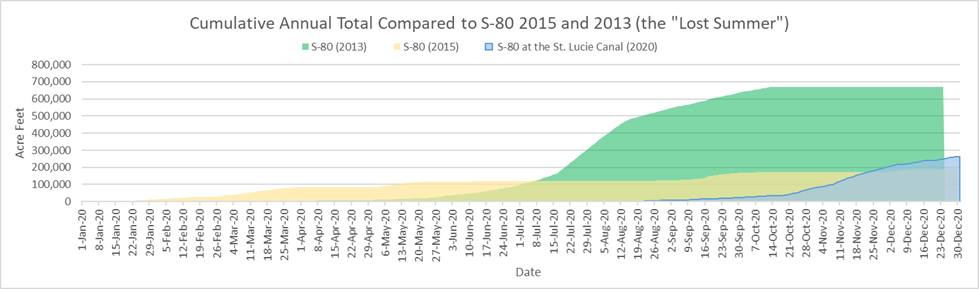
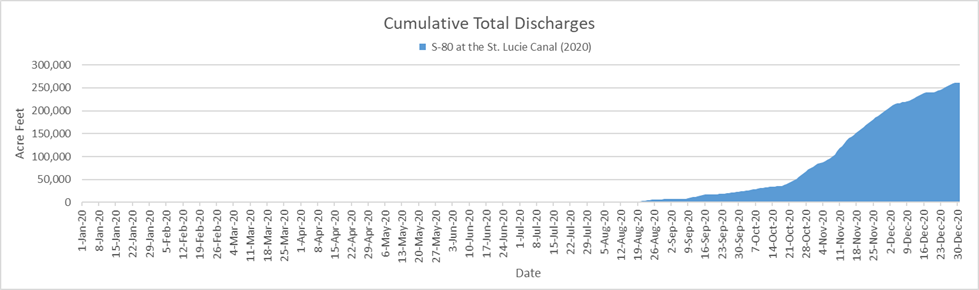
| Between January, 1, 2020 and December, 31, 2020, S-80 at the St. Lucie Canal discharged 85,243,838,373 (85.24 billion) gallons of water at an average of 234,831,511 gallons per day. | ||||||||||
| - This is equal to 261,604 acre feet of water at an average of 721 acre feet per day. | ||||||||||
| - That amount would submerge the peninsula of Stuart, Florida north of Monterey Rd. under 109 feet of water. | ||||||||||
| - 109 feet is equal to 81.6% the height of the water tower in downtown Stuart. | ||||||||||
| - This is equal to the volume of water that would be required to lower Lake Okeechobee by 6.72 inches (.56 feet) | ||||||||||
| Query Results Table | (DATA NOT VERIFIED) | |||||||||
| Date | # | cubic feet | gallons | billion gallons | Acre Feet | Stuart Inches | Stuart Feet | Lake Inches | ||
| Start Date of query results | 1/1/2020 | |||||||||
| End Date of query results | 12/31/2020 | |||||||||
| Number of Days | 366 | |||||||||
| Number of Days Missing Data | 3 | |||||||||
| Last date with numerical data | 12/31/2020 | 136 | ||||||||
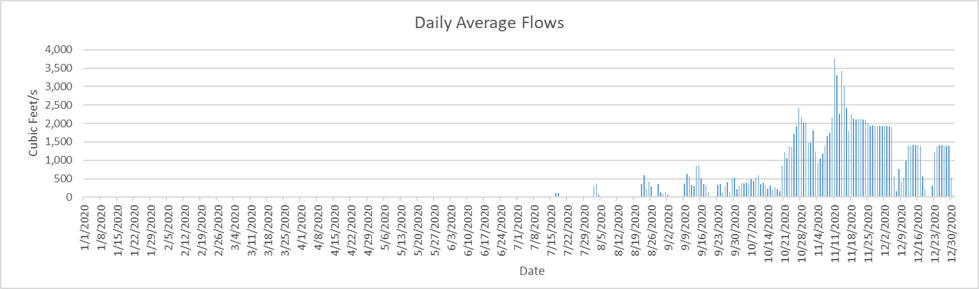
| Highest Flow Rate (per second)* | 11/10/2020 | 3,774 | 28,231 | |||||||
| Highest Flow Rate (per day)* | 11/10/2020 | 326,073,600 | 2,439,200,086 | 2.44 | 7,485.64 | 37.53 | 3.13 | 0.19 | ||
| Days of Highest Flow Rate | 1 | |||||||||
| Lowest Flow Rate (per second)* | 1/1/2020 | - | - | |||||||
| Lowest Flow Rate (per day)* | 1/1/2020 | - | - | - | - | - | - | |||
| Days of Lowest Flow Rate | 234 | |||||||||
| Average Flow Rate (per second) | 363.34 | 2,718 | ||||||||
| Average Flow Rate (per day) | 31,392,405 | 234,831,511 | 0.23 | 720.67 | 3.61 | 0.30 | 0.02 | |||
| Last Day with positive flow | 12/31/2020 | 11,750,400 | 87,899,102 | 0.09 | 269.75 | 1.35 | 0.11 | 0.01 | ||
| Last one day total | 12/31/2020 | 1 | 11,750,400 | 87,899,102 | 0.09 | 269.75 | 1.35 | 0.11 | 0.01 | |
| Last 7 days | 12/24/2020 | 7 | 666,316,800 | 4,984,396,149 | 4.98 | 15,296.56 | 76.69 | 6.39 | 0.39 | |
| Last 45 days | 11/16/2020 | 45 | 5,295,196,800 | 39,610,825,566 | 39.61 | 121,561.27 | 609.43 | 50.79 | 3.12 | |
| Last 90 days | 10/2/2020 | 90 | 10,346,659,200 | 77,398,391,079 | 77.40 | 237,527.16 | 1,190.81 | 99.23 | 6.10 | |
| Total Flow for 366 days | 11,395,442,880 | 85,243,838,373 | 85.24 | 261,603.97 | 1,311.52 | 109.29 | 6.72 | |||
| * = If there is more than one date of highest or lowest flow rate then the first date appears in the date column. | ||||||||||
| Stuart peninsula land area north of Monterey Rd = 3.74 sq miles or 2,393.6 acres | [Click for Map] | |||||||||
| Lake Okeechobee Average Surface Area = 467,000 acres (approx 730 sq mi). | [See LORS2008] | |||||||||
| The water tower in downtown Stuart is 134 feet tall | [TC Palm] | |||||||||
|
||||||||||
|
||||||||||
|
||||||||||
![[Click for Map]](http://thurlowpa.com/StuartNorthofMonterey.jpg)